If you want to trade gold successfully, you need more than luck — you need a gold trading strategy built on how gold actually behaves. Gold (XAUUSD) is one of the most actively traded instruments in the forex and CFD markets, valued for its volatility, liquidity, and deep connection to macroeconomic forces. But that same complexity trips up traders who approach it without a clear plan.
This guide covers everything you need to trade gold with confidence: the six key drivers of gold price movements, five battle-tested trading strategies (from scalping to swing trading), seasonal patterns, and a practical checklist for choosing a broker. Whether you are just learning how to trade gold forex or refining an existing approach, you will find actionable insight here.
Important risk notice: Trading gold and other financial instruments carries significant risk. Past performance does not guarantee future results. Always trade within your means and understand the risks involved before opening any position.
Understanding Gold Price Movements
Gold does not move randomly. Its price is driven by a consistent set of macro and market forces that repeat across cycles. Understanding these forces is the foundation of any effective XAUUSD trading strategy. Below are the six most important characteristics every gold trader should know.
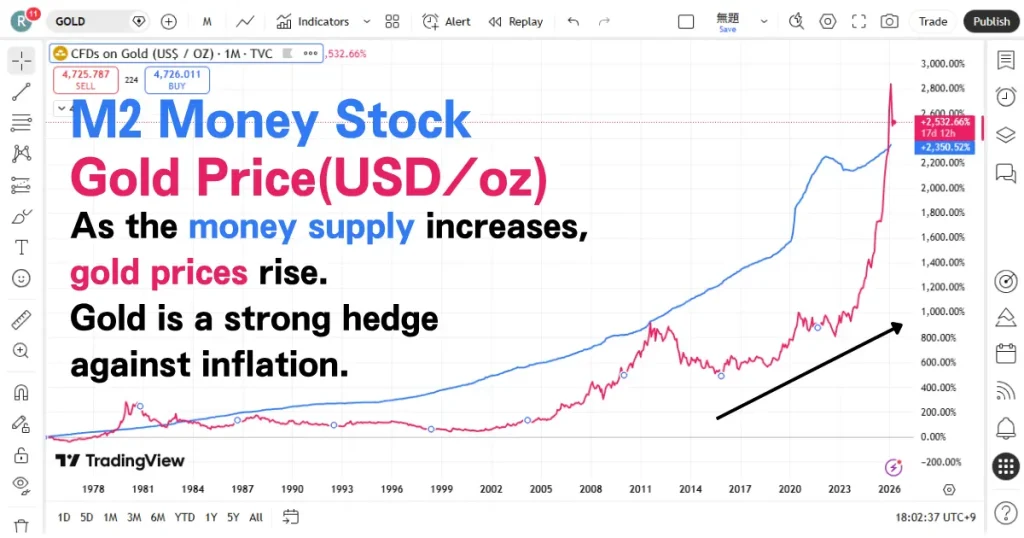
1. Gold Is in a Structural Long-Term Uptrend
Zoom out on any gold chart and the direction is clear: gold has been rising for decades. From under $300 per ounce in the early 2000s, gold surpassed $2,000 for the first time in 2020 and has continued setting new all-time highs since. This long-term uptrend is not accidental — it reflects the steady expansion of global money supply and the persistent erosion of fiat currency purchasing power.
Central banks worldwide, including those of China, Russia, India, and several emerging market economies, have been systematically increasing their gold reserves over the past decade. This institutional demand provides a structural floor beneath gold prices. For traders, this means that long-biased strategies tend to have a macro tailwind, while short positions against the primary trend require stronger conviction and tighter risk management.
2. Gold Is a Safe-Haven Asset That Surges in Crises
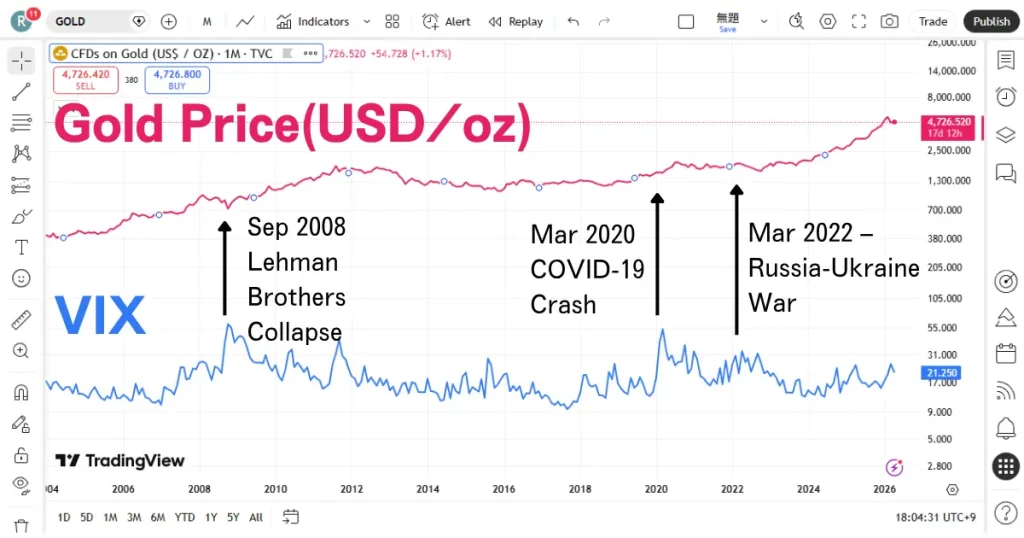
When fear spikes in financial markets — whether from geopolitical conflict, banking system stress, pandemic uncertainty, or recession risk — capital flows into gold. This safe-haven behavior is one of gold’s most reliable and tradeable characteristics. During periods of elevated market stress, gold frequently moves sharply higher even when equity markets are collapsing.
The VIX (Cboe Volatility Index, often called the “fear gauge”) has a notable relationship with gold. When the VIX spikes above 30, gold has historically shown strong positive price action. Monitoring the VIX alongside gold price gives traders an early warning system for potential breakout moves driven by risk-off sentiment.
3. Gold Has High Volatility — and That Creates Opportunity
Gold (XAUUSD) consistently ranks as one of the most volatile instruments available in the forex and CFD markets. Its average daily range regularly exceeds that of major currency pairs like EUR/USD or USD/JPY, often moving $15–$30 per ounce or more on significant news days. This high volatility is a double-edged sword: it creates larger profit opportunities but also demands strict risk management.
For traders, this means position sizing must account for gold’s wider price swings. A standard lot in gold (100 oz) means that a $10 move equals $1,000 in profit or loss. Using appropriate position sizes and always placing stop-loss orders is not optional when trading XAUUSD — it is essential.
4. US Interest Rates and Inflation Are Primary Price Drivers
Gold is highly sensitive to US monetary policy. Because gold pays no yield, it competes directly with interest-bearing assets like US Treasury bonds. When the Federal Reserve raises interest rates, the opportunity cost of holding gold increases, which typically pressures gold prices lower. Conversely, when the Fed cuts rates or signals a dovish pivot, gold tends to rally as the yield advantage of competing assets shrinks.
Inflation expectations add another layer. Gold is widely viewed as a store of value and inflation hedge. When Consumer Price Index (CPI) readings come in above expectations, or when the market anticipates a prolonged period of above-target inflation, demand for gold as a purchasing power hedge increases. Key events to monitor include:
- FOMC meetings and rate decisions — typically cause sharp gold moves
- US CPI and PCE releases — core inflation data directly influences Fed policy expectations
- Fed Chair press conferences and speeches — forward guidance shapes gold’s medium-term direction
- Non-Farm Payrolls (NFP) — strong labor data can delay rate cuts, pressuring gold
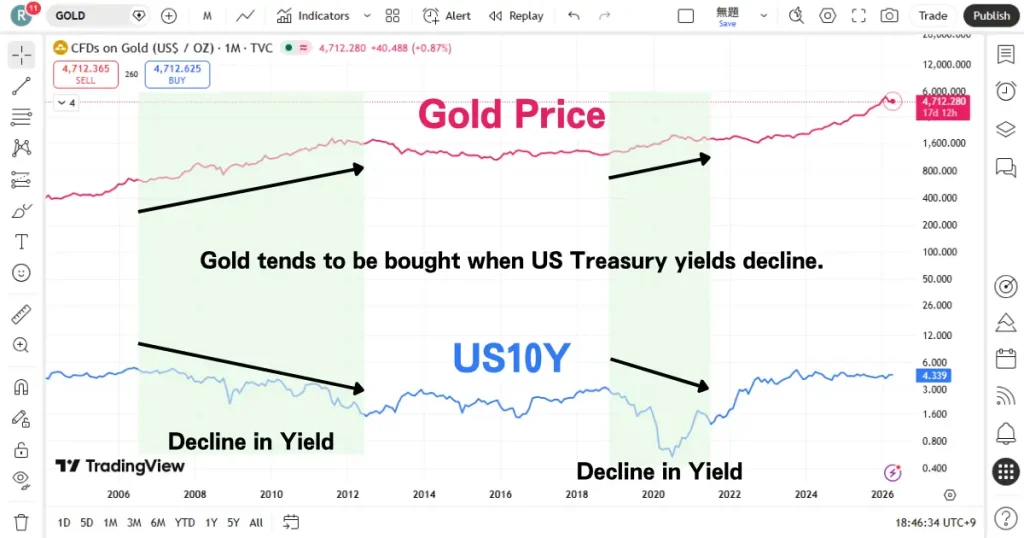
5. Gold Has an Inverse Correlation with US Treasury Yields
The relationship between gold and US Treasury yields — particularly the 10-year yield — is one of the most consistent and actionable correlations in financial markets. When real yields (nominal yield minus inflation expectations) rise, gold tends to fall. When real yields fall or turn negative, gold tends to rise.
This relationship holds because gold is a zero-yield asset. As Treasury yields rise, investors can earn more by holding bonds, reducing the relative attractiveness of gold. Monitoring the 10-year Treasury yield and the TIP/TLT spread (TIPS ETFs tracking real yields) can provide valuable confirmation signals for gold trades. When you see yields dropping ahead of a gold trade, that adds conviction to a long position.
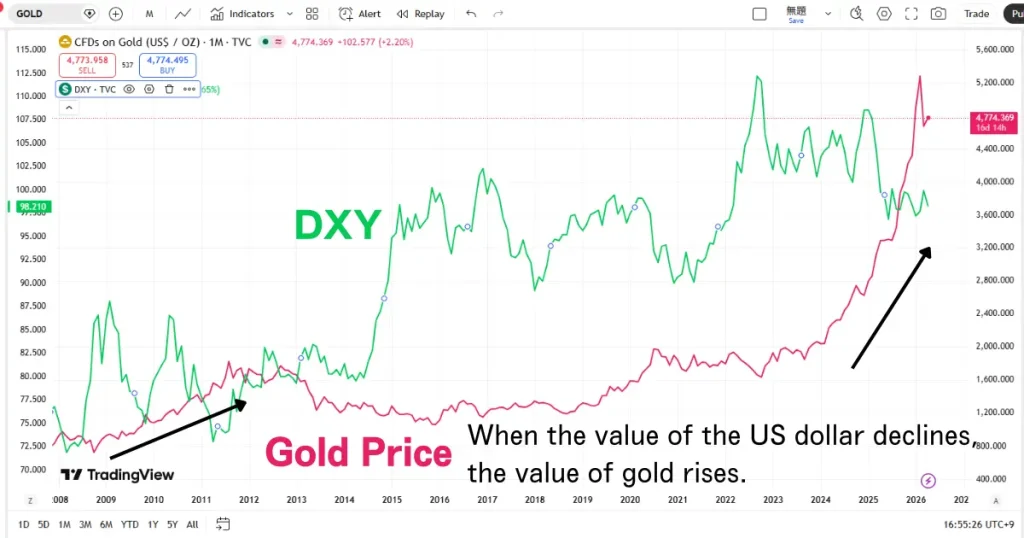
6. Gold Has an Inverse Correlation with the US Dollar
Gold is priced in US dollars globally, which creates a natural inverse relationship with the US Dollar Index (DXY). When the dollar strengthens, gold becomes more expensive for holders of other currencies, which tends to suppress demand and push prices lower. When the dollar weakens, gold becomes relatively cheaper in global terms, stimulating demand and supporting higher prices.
This correlation is not perfect — there are periods when both gold and the dollar rise together, typically during acute risk-off events when investors seek all safe-haven assets simultaneously — but it is reliable enough to use as a directional filter. Before entering a gold trade, checking the DXY direction adds a useful layer of confirmation. A weakening DXY strongly supports gold long positions.
5 Proven Gold Trading Strategies
With a solid understanding of what drives gold prices, you can apply these strategies with much greater precision. Each approach below suits different trading styles, time commitments, and risk tolerances. Many experienced traders combine two or more of these methods.
Strategy 1: Fundamental Analysis — Trade the Macro Events
Fundamental analysis means reading gold’s price through the lens of economic data, monetary policy, and geopolitical events. This is not about predicting every tick — it is about positioning yourself on the right side of the major trend based on macro conditions.
How to apply it:
- Build a macro view. Is the Federal Reserve in a tightening or easing cycle? Are real yields rising or falling? Is inflation above or below the Fed’s 2% target? Answering these questions gives you a directional bias for gold.
- Watch the economic calendar. Mark FOMC decision dates, CPI release dates, and NFP Fridays on your calendar. These events reliably move gold by significant amounts — often $20–$50 or more in a single session.
- Monitor geopolitical risk. Escalating conflicts, banking crises, or major political uncertainty (including US election cycles) tend to trigger safe-haven buying in gold. Position sizing before high-impact events should be reduced to manage gap risk.
- Confirm with technicals. Even with a strong macro view, enter trades at technically favorable levels — support zones, moving average bounces, or after a pullback from recent highs. The macro provides the direction; the technical provides the entry.
Fundamental analysis is best suited for position traders and swing traders who hold trades from several days to several weeks. It requires patience and the discipline to hold through short-term noise when your macro thesis is intact.
Strategy 2: Trend Following — Ride the Moving Averages
Trend following is perhaps the most consistently profitable approach for gold over the long run. Because gold has a structural long-term uptrend and moves in sustained directional phases, trend-following strategies capture the bulk of major moves while limiting exposure during choppy, sideways conditions.
Key tools:
- 200-day SMA (Simple Moving Average): The most widely watched long-term trend indicator. When gold is trading above the 200 SMA, the long-term trend is up. When it is trading below, caution is warranted for long trades.
- 50-day SMA: Used as a medium-term trend filter. A golden cross (50 SMA crossing above 200 SMA) is a bullish signal; a death cross is bearish.
- 21-period EMA (Exponential Moving Average): Useful on the daily chart for identifying short-term trend direction and as a dynamic support/resistance level during trending phases.
Pullback entry technique: Rather than chasing breakouts, experienced trend followers wait for the price to pull back to a moving average or key support level and enter when momentum confirms the trend is resuming. On the daily chart, this means waiting for a pullback to the 21 EMA during an uptrend, then entering when a bullish candlestick pattern (such as a hammer or engulfing candle) appears. This approach offers a much better risk-reward ratio than buying at the highs.
Example setup (daily chart):
- Confirm gold is above both the 50 SMA and 200 SMA (uptrend confirmed).
- Wait for a pullback of 2–4% from a recent swing high.
- Look for the price to test and hold the 21 EMA or a prior support level.
- Enter long on the close of a bullish reversal candle.
- Place stop-loss below the swing low of the pullback.
- Target the previous swing high or a 2:1 risk-reward ratio minimum.
Strategy 3: Seasonal and Anomaly Trading
Gold exhibits remarkably consistent seasonal patterns that have held up over decades of market data. While past seasonality does not guarantee future performance, these patterns reflect real underlying demand cycles — particularly jewelry demand from Asia ahead of major festivals and wedding seasons.
Key seasonal tendencies for gold:
- January–February (strong): Gold has historically shown strength in the early months of the year, driven in part by fresh institutional allocations and Indian wedding season demand.
- March–May (mixed/weak): Gold tends to consolidate or pull back during this period as Q1 demand fades. This can be a good time to wait for a seasonal dip before re-entering longs.
- June–August (recovery and summer rally): Gold often begins recovering in late June and tends to show strength through August, partly driven by Indian festival buying ahead of Diwali and Dussehra seasons.
- September–October (seasonally strong): Historically one of the strongest months for gold, driven by the combination of festival buying and increased safe-haven demand heading into year-end.
- November–December (year-end profit taking): Gold sometimes faces selling pressure as fund managers take profits before year-end, creating a buying opportunity for the following January cycle.
How to use seasonal patterns: Do not trade seasonal patterns in isolation. Use them as a probability filter to add conviction to your fundamental or technical trades. If your macro view is bullish on gold and seasonality is also bullish, that alignment strengthens the case for a long position.
Strategy 4: Gold Scalping — High Frequency, Small Targets
Scalping gold involves opening and closing multiple trades within a single trading session, targeting small price moves of $1–$5 per ounce. Given gold’s high daily volatility and deep liquidity during peak trading hours, scalping can be effective — but it demands intense focus, fast execution, and very tight risk management.
Best times to scalp gold:
- London open (3:00–5:00 AM EST): Gold volatility spikes as European trading begins. This session often sets the tone for the day.
- New York open (8:00–10:00 AM EST) and overlap with London (8:00 AM–12:00 PM EST): The highest-volume and most volatile period for gold. Major economic releases typically happen during this window.
- Avoid: The Asian session (outside of major news) tends to be slower and more choppy for gold, making scalping less effective.
Scalping setup example (1-minute or 5-minute chart):
- Identify the intraday trend direction using a 15-minute chart (above or below 20 EMA).
- On the 1-minute or 5-minute chart, wait for a short pullback against the intraday trend.
- Enter in the direction of the intraday trend when momentum turns back (RSI crossing 50, or price reclaiming a short-term EMA).
- Target $2–$5 per ounce with a stop of $2–$3 per ounce.
- Exit before major news events; never hold a scalp through an FOMC announcement or NFP release.
Broker requirements for gold scalping: Scalping gold requires a broker with tight spreads (ideally under $0.30–$0.50 per ounce), fast execution, and no restrictions on scalping strategies. Raw spread ECN-style accounts are strongly preferred. Brokers like Pepperstone, IC Markets, and OANDA are popular choices among scalpers for their execution quality on gold.
Note for US traders: scalping gold via forex/CFD is not available through US-regulated brokers due to CFTC regulations that restrict CFD trading for US residents. US-based traders who want short-term gold exposure typically use gold futures (COMEX /GC contracts via CME Group) or leveraged gold ETFs.
Strategy 5: Gold Swing Trading — Multi-Day Positions for Larger Moves
Swing trading gold means holding positions for 2–10 days, capturing a meaningful portion of a directional price move while avoiding the noise of intraday fluctuations. This is arguably the most practical approach for traders who cannot monitor charts throughout the trading day.
Core swing trading principles for gold:
- Trade with the daily chart trend. Only take long swings when gold is above its 50 SMA on the daily chart; only consider shorts when it is below.
- Use the 4-hour chart for entry timing. Once the daily chart confirms the trend direction, drop to the 4-hour chart to identify precise entry points — typically after a pullback to support or a moving average.
- Set wider stops. Swing trades need room to breathe. A stop of $10–$20 below a swing low is more appropriate than a $3 stop.
- Target swing highs or Fibonacci extension levels. Measure the prior swing range and project potential targets using the 1.272 or 1.618 Fibonacci extension.
- Manage open positions actively. Once a swing trade is profitable, consider moving the stop to breakeven after price has moved in your favor by the initial risk amount.
Example swing setup:
- Daily chart shows gold above 50 SMA and 200 SMA, in a clear uptrend.
- Gold pulls back for 2–3 days to test the 21 EMA or a prior breakout level.
- 4-hour chart shows a bullish reversal pattern (hammer, morning star, or RSI divergence) at the support level.
- Enter long at the close of the reversal candle on the 4-hour chart.
- Stop-loss placed $15 below the recent swing low.
- First target: the recent swing high. Second target: the 1.272 Fibonacci extension of the prior swing.
- Move stop to breakeven once price reaches the first target.
Swing trading is particularly well-suited to trading gold because gold’s swings tend to be proportionally large — a single swing move can easily cover $50–$150 per ounce, offering excellent risk-reward potential for patient traders.
For more on how to get started with gold trading, see our guide: How to Start Trading Gold in Forex. And before committing real capital, make sure you understand the risks: Gold Trading Risks Every Trader Must Know.
How to Choose a Gold Trading Broker
Your broker has a direct impact on your trading results — through spreads, execution speed, swap rates, and available leverage. Choosing the wrong broker can silently eat into your profitability even when your trades are directionally correct. Here is what to evaluate when selecting a broker for gold trading.
Spreads on Gold (XAUUSD)
The spread is the difference between the bid and ask price — the cost you pay on every trade. For gold, spreads typically range from $0.10 to $0.50 per ounce at reputable brokers during normal market hours. For scalpers and high-frequency traders, even a $0.10 difference in spread has a meaningful impact over hundreds of trades.
Brokers known for competitive gold spreads include Pepperstone (Razor account), IC Markets (Raw Spread account), and OANDA. For US residents, OANDA and Forex.com (both CFTC/NFA regulated) offer gold trading with competitive pricing.
Overnight Swap Rates (Rollover Costs)
If you hold gold positions overnight — as swing traders do — you will be charged (or credited) a swap rate, also called rollover. For long XAUUSD positions, the swap is typically negative (a cost), because you are effectively paying the USD interest rate on the gold position. During high-rate environments, these overnight charges can become significant over a multi-day hold.
Before opening a swing trade, check your broker’s current XAUUSD swap rate and calculate the cumulative cost over your expected holding period. Some brokers offer swap-free (Islamic) accounts for traders who prefer to avoid rollover charges.
Execution Quality and Slippage
For strategies that depend on precise entries — especially scalping and news trading — execution quality is critical. Look for brokers that offer STP (Straight-Through Processing) or ECN (Electronic Communication Network) execution, which routes your orders directly to liquidity providers without a dealing desk.
Leverage and Margin Requirements
Leverage in gold trading varies significantly by jurisdiction and broker:
- US traders (CFTC/NFA regulated): For COMEX gold futures, margin requirements are set by the exchange (typically around $7,000–$10,000 per contract for a 100 oz /GC contract). For gold forex, US retail brokers may offer up to 20:1 leverage on gold.
- International traders (FCA, ASIC, CySEC regulated): Retail clients in the UK and EU are limited to 20:1 leverage on gold under regulatory rules.
- Offshore brokers: May offer leverage of 200:1 or higher on gold. While this amplifies potential gains, it also dramatically increases the risk of account wipeout. Approach with caution.
Negative Balance Protection
Negative balance protection means the broker ensures your account balance cannot go below zero, even in the event of extreme market gaps. Important note: negative balance protection is not available at US-regulated brokers (CFTC/NFA) and is not required under US regulations. This is one reason why position sizing and using guaranteed stop orders (where available) is even more important for US-based traders.
Brokers offering negative balance protection for non-US clients include Pepperstone (ASIC/FCA regulated), XM (CySEC/ASIC regulated), and IG (FCA/ASIC regulated). For US residents, Interactive Brokers is a regulated option offering gold futures and options on COMEX with strong capital protections.
Alternatives for US Traders: Futures and ETFs
Because US residents cannot trade gold as a forex CFD through CFTC-regulated brokers, there are established and regulated alternatives:
- COMEX Gold Futures (/GC): Traded on the CME Group exchange. Each contract is 100 troy ounces. Available through futures brokers like Interactive Brokers, TD Ameritrade/thinkorswim, and NinjaTrader. Micro contracts (MGC, 10 oz) are also available for smaller accounts.
- Gold ETFs (GLD, IAU, GLDM): SPDR Gold Shares (GLD) and iShares Gold Trust (IAU) are the most liquid gold ETFs. They track spot gold price closely and can be traded in any standard brokerage account.
- Gold options: Available on both GLD (options on the ETF) and /GC (options on futures). Allow traders to define their maximum risk while maintaining upside exposure.
US Tax Considerations for Gold Traders
Understanding the tax treatment of gold trading profits is essential for US-based traders. The rules differ depending on how you access gold exposure.
- Physical gold and gold ETFs (GLD, IAU): The IRS classifies gold as a “collectible.” Long-term capital gains on collectibles are taxed at a maximum rate of 28%, compared to 20% for most other long-term capital assets.
- Gold futures (/GC contracts): Gold futures are “Section 1256 contracts” under the IRS code. They receive favorable 60/40 tax treatment: 60% of gains are taxed as long-term capital gains and 40% as short-term, regardless of how long the position was held.
- Forex gold (XAUUSD) via US brokers: Treatment varies. Some forex gold transactions may fall under Section 988 (ordinary income/loss), while others may qualify for Section 1256 treatment. Consult a tax professional.
This is a general overview, not tax advice. Consult a qualified tax professional for advice specific to your situation.
Frequently Asked Questions About Gold Trading
Ready to put these strategies into practice? Start by building your foundational knowledge with our guide on how to start trading gold in forex, and make sure you have a clear understanding of the key risks involved in gold trading before committing real capital. For more trading tools and resources, visit Copi Tools.