Social media is flooded with traders showing “80% win rate” or “30% monthly returns.” But should you trust those numbers?
The short answer: forex trading results are shockingly easy to fake.
This article explains 3 specific methods used to fabricate impressive trading results, plus the red flags that help you spot fake win rates — so you can avoid being deceived by fraudulent traders and EAs.
Forex Results Can Be Easily Faked
Faking forex trading results requires no special skills. Anyone can do it.
You’ll often see “consistently profitable traders” on social media, but there’s almost no way to verify whether their results are genuine.
- MT4/MT5 trade history can be altered with basic image editing
- Demo account results can be presented as live trading
- Certain strategies genuinely win — temporarily ← This is the most dangerous trick
The strategies described below can actually produce real profits under the right market conditions. But they all carry the risk of inevitable blowup. By cherry-picking only the profitable period, anyone can become a “fake professional trader”.
3 Methods Used to Fake Forex Trading Results
None of these require special skills. Anyone can easily play the role of a “consistently winning trader” using these techniques.
Method 1: Hedge on Two Accounts, Show Only the Winner
The simplest and oldest trick. Open two accounts, place opposite trades (buy on one, sell on the other) at the same time. One account always wins — just share that one on social media, and you’re a “winning trader”.
The beauty of this scam is its low cost. Since you’re hedging, one side’s loss offsets the other’s gain — the only real cost is the spread, and you can mass-produce “winning trades”.
Add high leverage, and you can create eye-catching results like “10× account growth in days” effortlessly.
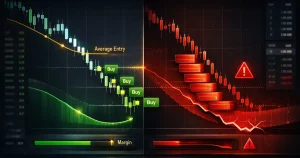
Method 2: Martingale / Averaging Down to Create a Perfect Equity Curve
Martingale and averaging-down (also called cost averaging or dollar-cost-averaging into losers) strategies can produce genuinely profitable results — which is exactly what makes them dangerous.
Averaging down means adding to a losing position to lower your average entry price. Martingale means doubling your lot size after every loss, so one win recovers all previous losses.
Both are based on the idea of “it’ll come back eventually.” As long as the market stays in a range, the closed P&L chart shows a beautiful, steady upward curve.
The fatal flaw:
- A strong trend causes unrealised losses to balloon rapidly
- Eventually, a “market that never comes back” arrives
- The account blows up completely
From years of analysing copy trading strategies, we’ve witnessed martingale and averaging-down EAs blow up within months — countless times. While some skilled traders do use these techniques responsibly, the ease of creating impressive-looking results makes this a favourite tool of fake traders.
Method 3: Grid Trading to Simulate Consistent Profits
Grid trading works similarly to martingale — it can create the illusion of steady profits.
Grid trading places buy and sell orders at fixed price intervals. As price oscillates, trades keep hitting take-profit levels. As long as the market ranges, profits accumulate steadily.
The fatal flaw is identical:
- A directional trend causes unrealised losses to surge
- When price breaks out of the range, massive losses materialise
- The system that “always comes back” finally doesn’t
The difference from martingale is that grid systems hold positions in both directions from the start. But the core problem is the same: it only works in range-bound markets and is a ticking time bomb.
How to Spot Fake Trading Results
1. Are Unrealised Losses & Drawdown Disclosed?
The single most important red flag. Is floating P&L and maximum drawdown visible — or only closed trades?
Martingale and grid strategies can show a perfect upward curve in closed P&L, while hiding massive unrealised losses underneath.
- Can you see equity (including floating P&L), not just balance?
- Is maximum drawdown (largest peak-to-trough decline) disclosed?
- Are there long periods of unrealised losses? (bag-holding indicator)
Any trader or EA that only shows closed trade history — pay close attention to how long they hold underwater positions.
2. Are Losses Managed Properly?
How does the trader handle losing trades? This is a crucial judgment point.
Even the best traders lose. A 90%+ win rate or zero stop-loss history is inherently suspicious.
- Claims of extremely high win rates (win rates can be manufactured)
- Never cutting losses even as floating losses grow (inevitable blowup)
From years of analysing copy trading strategies, what we’ve found is: genuine traders are skilled at losing. How someone manages losses is a far better indicator of skill than win rate or profit percentage. Check whether stop-losses are being used before losses spiral.
3. A Perfect Equity Curve Is Actually a Danger Sign
A smooth, consistently upward equity curve looks impressive — but it’s often a sign of hidden risk.
Markets behave differently each month. Some monthly variation in results is natural. If profits are suspiciously steady month after month, the trader may be using martingale or averaging to pile up unrealised losses while only showing realised gains.
Counterintuitively, traders with visible losing months are often more trustworthy — their results reflect genuine market conditions rather than manufactured consistency.
4. Is Forward-Test Data Available?
When evaluating EAs or automated strategies, always check for forward-test results — real-time performance on live markets.
Backtests use historical data and can be curve-fitted to show any result you want. Forward tests, ideally verified on third-party platforms like Myfxbook, provide far more credible evidence.
- Are there forward-test results, not just backtests?
- Is the strategy verified on a third-party site (Myfxbook, FX Blue)?
- Has the track record lasted at least 3 months?
An EA that only shows backtest results has zero guarantee of performing the same way in live markets.
Summary: Don’t Judge by Results Alone
The 3 methods used to fake forex results:
- Hedge on two accounts, show only the winner
- Use martingale / averaging down to create an upward curve
- Use grid trading to simulate consistent profits
How to spot fakes:
- Check for unrealised loss / drawdown disclosure
- Look for proper stop-loss usage and losing trades
- Be suspicious of perfectly smooth equity curves
- Demand forward-test data, preferably third-party verified
Those flashy profit screenshots on social media may have been manufactured using exactly these methods. Never judge a trader or EA by results alone — always verify how they trade, and what risks they’re hiding.
For more on evaluating copy trading strategies safely, see our copy trading scam prevention guide.