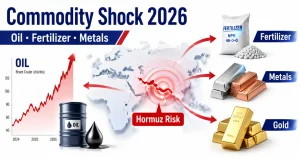





The crude oil price forecast for 2026 has been rewritten overnight. According to the IEA’s May 2026 Oil Market Report, a Middle East conflict that began on 28 February has shut in more than 14 million barrels per day (mb/d) of Gulf production, drained global inventories at a record pace, and pushed benchmark prices through a $144/bbl peak before they slipped back toward $110/bbl. If you trade oil CFDs, this is not a normal cyclical swing — it is a live stress test of supply chains, refinery runs, and geopolitical risk pricing.
This article walks through what the Hormuz disruption means, why prices have been so volatile, how demand and supply are adjusting, what the IEA assumes about recovery from June, and what that implies for Brent versus WTI and position sizing in oil CFD trading.
Crude Oil Price Forecast 2026: A Supply Shock Unlike Any Recent Cycle
Before the conflict, many analysts expected modest demand growth and comfortable OPEC+ spare capacity. That baseline is gone. The IEA now forecasts global oil demand falling by 420 thousand barrels per day (kb/d) year-on-year in 2026, to 104 mb/d — 1.3 mb/d below its pre-war projection. Supply is even more constrained: global output fell to 95.1 mb/d in April, down 1.8 mb/d from March, with cumulative losses since February totalling 12.8 mb/d.
Put differently, the market is trying to price two contradictory forces at once: an acute physical shortage through the Strait of Hormuz, and rapid demand destruction as refiners cut runs and end-users ration fuel. Personally, I think that tension explains why North Sea Dated — a key physical benchmark — traded in an almost $50/bbl range in April alone.
What the Hormuz Strait Blockade Means for Oil Supply
The Strait of Hormuz is a narrow waterway linking the Persian Gulf to the open ocean. Roughly one-fifth of global seaborne oil transits this chokepoint. When tanker traffic is restricted, Gulf exporters cannot move crude to Asia and Europe at normal volumes — even if fields still produce, barrels pile up onshore or production is curtailed.
Why This Chokepoint Moves Global Benchmarks
Brent and Dubai-linked grades price much of the oil that flows east of Suez. A Hormuz disruption therefore hits Brent-sensitive markets first: North Sea Dated averaged $120.36/bbl in April, up about $16.50/bbl month-on-month, before spot prices spiked even higher. WTI, anchored to US inland logistics, reacts too — but the spread between Atlantic and Gulf benchmarks widens when Middle East exports stall.
From what I’ve seen in past geopolitical episodes, traders underestimate how quickly product markets tighten once crude stops moving. The IEA notes that while refinery run cuts eased crude tightness temporarily, tightness is spreading into middle distillates — diesel and jet fuel — where Gulf refiners were major exporters.
The Scale of Shut-In Production
Output from Gulf countries affected by the Hormuz closure was 14.4 mb/d below pre-war levels as of the IEA’s April assessment. Cumulative supply losses since February exceed one billion barrels. Saudi Arabia, the UAE, Iraq, and Kuwait — core OPEC producers — all show sharp April declines versus their implied OPEC+ targets.
| Country | Apr 2026 Supply (mb/d) | vs Implied Target (mb/d) |
|---|---|---|
| Saudi Arabia | 6.98 | -3.18 |
| Iraq | 1.35 | -2.85 |
| Kuwait | 0.57 | -2.02 |
| UAE | 2.44 | -0.94 |
| Russia (OPEC+) | 8.83 | -0.81 |
| Total OPEC+ | 34.13 | — |
Honesty check: these numbers are not a temporary maintenance outage. More than 14 mb/d shut in is larger than the combined production of most OPEC members. If you’re the type of trader who only watches weekly US inventory prints, this crisis demands a Gulf-centric dashboard instead.
Why Oil Prices Swung From $144 to Below $100 — Then Back to $110
North Sea Dated hit a high near $144/bbl, then plunged below $100/bbl, before rebounding to around $110/bbl at the time of the IEA report (mid-May 2026). That is not random noise — it reflects alternating headlines on whether a US–Iran accord might reopen the Strait, layered on top of real-time inventory and run-cut data.
Physical Tightness vs. Negotiation Headlines
On physical grounds, the market remains stressed. Observed global inventories fell by 129 million barrels (mb) in March and a further 117 mb in April — a combined draw of 250 mb over two months, equivalent to 4 mb/d. April on-land stocks alone dropped 170 mb (-5.7 mb/d), while oil-on-water rose 53 mb as cargoes stalled. OECD on-land inventories plummeted 146 mb (-4.9 mb/d).
Against that backdrop, any rumour of diplomatic progress can trigger violent sell-offs — even if barrels have not yet flowed. In my experience, that pattern punishes leveraged longs who treat peace talks as confirmed supply restoration.
Futures Spreads Signal Near-Term Scarcity
Prompt-month WTI and Brent time spreads ended April near $5/bbl, a classic backwardation signal: the market pays a premium for immediate barrels. North Sea Dated’s premium to ICE Brent futures peaked at a record $35/bbl in mid-April before narrowing to about $3/bbl in early May as flat prices fell — evidence of extreme dislocation in physical versus paper markets.
The spread is too wide for comfort if you are scalping Brent CFDs on headline alone — structure matters as much as direction here.
Demand Side: Refiners and End-Users Are Pulling Back
High prices are doing what they always do: destroying marginal demand. The IEA expects 2Q26 demand down 2.45 mb/d year-on-year, with OECD accounting for 930 kb/d of the drop and non-OECD for 1.5 mb/d. For full-year 2026, demand contracts 420 kb/d to 104 mb/d.
Petrochemicals and Aviation Lead the Decline
Petrochemical feedstock availability is increasingly constrained as Gulf naphtha and LPG exports disappear from normal trade routes. Aviation activity is running well below normal; jet fuel prices nearly tripled after Middle Eastern product exports were cut off, then eased somewhat as flights were cancelled or rerouted.
I wouldn’t recommend sizing oil long positions as if summer driving season will fully offset these losses — the IEA explicitly warns that higher prices, a weaker macro backdrop, and official demand-saving measures will weigh further on fuel use through the year.
Import Cuts Across East Asia
Refiners have slashed crude imports in step with lower runs. According to Kpler data cited by the IEA, Chinese seaborne crude imports fell 3.6 mb/d from February to April. Japan reduced imports by 1.9 mb/d, Korea by 1 mb/d, and India by 760 kb/d. Global refinery throughput in April was roughly 5 mb/d below year-ago levels — a temporary relief valve for crude balances, but a warning sign for product tightness ahead.
Compared to 2022’s price spike, today’s demand response is faster because Asian import hubs are directly in the supply chain break — not just paying higher prices.
Supply Side: Atlantic Barrels, Stock Releases, and Gulf Workarounds
The market entered the crisis with a surplus, which bought time. Producers and consumers are now filling part of the Hormuz gap through three channels: non-Middle East production growth, strategic and commercial stock draws, and redirected Gulf exports.
Atlantic Basin Exports Surge
Atlantic Basin crude exports to hard-hit East-of-Suez markets rose 3.5 mb/d since February, with notable gains from the United States, Brazil, Canada, Kazakhstan, and Venezuela. Americas supply growth expectations for 2026 were revised up by more than 600 kb/d since January, to 1.5 mb/d average growth. Russia’s crude exports also increased as refinery attacks cut domestic runs and the US temporarily waived sanctions on Russian oil already on water.
Personally, I lean toward Brent CFDs when tracking this leg of the story — Atlantic barrels compete directly with Middle East grades in Asia, which keeps Brent–Dubai spreads noisy but informative.
Strategic Releases and Saudi/UAE Rerouting
Saudi Arabia and the UAE have redirected some cargoes to load at terminals outside the Strait. Commercial and government strategic stocks in importing countries are flowing into markets — OECD on-land draws of nearly 5 mb/d in April show how aggressively governments are tapping buffers.
Refinery crude throughputs are still forecast to plunge 4.5 mb/d in 2Q26 to 78.7 mb/d, and by 1.6 mb/d for 2026 overall to 82.3 mb/d, as operators deal with damaged infrastructure, export restrictions, and scarce feedstock. Refining margins stay historically elevated, especially for middle distillates — a reminder that “oil” is crude and products, not a single line on a chart.
IEA Recovery Scenario — and Downside Risks If Talks Fail
The IEA’s base case assumes Hormuz flows gradually resume from June 2026. Even then, global supply averages 102.2 mb/d for the year — down 3.9 mb/d versus pre-crisis expectations. The oil market remains in deficit through the fourth quarter, with inventories already drawing at a record clip heading into peak summer demand.
What Gradual Reopening Implies for Prices
Demand could swing back to growth late in the year if a deal allows Strait traffic to normalise from 3Q26. Supply, however, will likely lag: fields cannot restart instantly, and damaged logistics need repair. The IEA therefore sees continued balance tightness even under a diplomatic breakthrough — which, in my view, caps sustained moves below triple-digit Brent unless demand destruction accelerates further.
Failure or Delay: The Upside Tail Risk
At the time of writing, US and Iranian negotiators remained deadlocked over terms to reopen the Strait and end the war. If talks collapse or fighting escalates, the 12.8 mb/d cumulative loss figure keeps climbing and stock draws continue. CME Group economist Erik Norland noted in April 2026 that cautious capital was seeking US dollar safety as the conflict dragged on — a dynamic that can simultaneously support dollar-denominated commodities and trigger risk-off equity moves, complicating correlation trades.
Honestly, I would not treat $110/bbl as a ceiling while 14 mb/d stays offline and summer product demand approaches. The downside risk on failed talks is a return toward the $144 area; the downside risk on a surprise deal is a gap lower toward pre-war levels near $80–90/bbl — both tails are fat.
Oil CFD Trading in 2026: Volatility, Spreads, and Catalysts
CFD traders do not take delivery of barrels — but you still inherit the full volatility of a market moving on mb/d inventory math and headline diplomacy. Here is how I frame risk in this environment.
Position Sizing When Daily Ranges Exceed $10
April’s $50/bbl trading band on North Sea Dated translates into enormous intraday swings on Brent and WTI CFDs. If your account risk rule is 1% per trade, halve nominal size versus last year — or widen stops and accept lower leverage. Overnight gaps on weekend headlines are real; swap costs on spot CFDs accumulate if you hold through volatile weeks.
For those who want to react quickly to Strait headlines, limit orders beat market orders when liquidity thins. I wouldn’t recommend martingale-style averaging on oil here; the tail risk is asymmetric in both directions.
Brent vs WTI: Middle East War, Atlantic Relief
Rule of thumb from the existing crude oil CFD guide: trade Brent when Gulf geopolitics dominate; trade WTI when US inventories and shale data lead. In May 2026, Brent should carry a geopolitical premium while WTI benefits from record US export volumes — but both can gap together on macro risk-off days. Monitor the Brent–WTI spread as a gauge of how much Asia is paying for Atlantic replacement barrels.
Against WTI alone, Brent feels more suited to this crisis — the Hormuz strait oil supply story is fundamentally a seaborne Brent/Dubai problem.
Catalysts Worth Calendar Space
- Strait of Hormuz traffic data — tanker counts and insurance premiums lead official production stats.
- IEA/OPEC monthly reports — supply revisions for Gulf states move faster than demand forecasts.
- OECD stock releases — further SPR announcements can cap spikes but deplete buffers for 2027.
- Refinery run cuts in Asia — import data from China, Japan, and Korea signal real-time demand destruction.
- US dollar moves — see our DXY explainer for why a stronger dollar can offset oil rallies for non-USD account holders.
Picture this: a headline hits that talks progressed — Brent drops $8 in an hour — then physical traders note no tankers moving, and the contract reclaims half the loss. That is the 2026 oil CFD environment.
Summary: A Deficit Market With Binary Headline Risk
The 2026 crude oil outlook is dominated by a historic Hormuz supply shock: 14.4 mb/d shut in, inventories falling 250 mb in two months, refinery runs collapsing, and demand forecast to shrink for the first time in years. Prices near $110/bbl reflect neither full normalization nor worst-case scarcity — they reflect a market waiting on diplomacy while physically draining stocks.
If you want exposure with flexible sizing and near-24-hour sessions, oil CFDs on a regulated offshore broker are the practical route — but reduce leverage, respect Brent–WTI differences, and treat every headline on Strait talks as unconfirmed until tanker data confirms it.