



The commodity market outlook for 2026 no longer looks like a quiet year of soft landing and modest reflation. In February, Brent crude averaged $71.1/bbl; by April, Pink Sheet data shows $120.4/bbl — a swing that captures why commodity prices in 2026 matter far beyond oil desks. When the Strait of Hormuz effectively closed to tanker traffic in March, the World Bank described the episode as the largest oil supply loss on record, with Brent rising $46/bbl in a single month, the largest monthly increase ever recorded.
Yet crude was only the headline. Urea surged past $725/mt in March and $857/mt in April. Aluminum touched $3,600/mt. The precious metals index is forecast up 42.4% year-on-year. This guide maps the cross-commodity cascade — energy, fertilizers, base metals, agriculture, and precious metals — and what it means for CFD commodities traders who need a single dashboard, not siloed charts. For deeper dives, see our crude oil price forecast 2026, gold price forecast 2026, silver price forecast 2026, and platinum palladium 2026 coverage, plus our gold vs silver trading comparison.
Commodity Market Outlook 2026: From $71 Brent to a Full-Market Shock
World Bank Commodity Markets Outlook (CMO) April 2026 revises the total commodity price index (2010=100) to 113.7 for 2026 — up 15.5% year-on-year and the first annual rise for the complex since 2022. That is roughly 25 percentage points above what the Bank expected in its January forecast — a genuine shock revision, not a rounding error.
| Index (2010=100) | 2024 | 2025 | 2026f | YoY | 2027f |
|---|---|---|---|---|---|
| Total | 105.1 | 98.4 | 113.7 | +15.5% | 99.8 |
| Energy | 101.5 | 90.0 | 111.3 | +23.6% | 92.1 |
| Non-Energy | 112.5 | 115.4 | 118.7 | +2.8% | 115.4 |
| Fertilizers | 117.6 | 138.7 | 181.3 | +30.7% | 152.1 |
| Metals & Minerals | 106.7 | 112.2 | 130.8 | +16.6% | 122.3 |
| Base Metals | 114.1 | 122.3 | 145.8 | +19.2% | 135.6 |
| Precious Metals | 180.2 | 258.6 | 368.3 | +42.4% | 337.7 |
| Agriculture | 115.0 | 115.7 | 109.3 | −5.6% | 110.0 |
Personally, I think the table tells you more than any single headline: energy and fertilizers are doing the heavy lifting, agriculture is actually forecast lower on the index, and precious metals are on a separate macro planet. If you trade multiple CFD asset classes, that divergence is the story of 2026.
How the Hormuz Closure Chained Through Commodity Markets
The Strait of Hormuz is not just an oil chokepoint. Tankers through it carry crude, LNG, refined products, fertilizer feedstocks, and aluminum exports from Gulf producers. When traffic effectively stopped in March 2026, the shock propagated in three layers:
- Physical stop: barrels and cargoes could not reach Asia and Europe at normal volumes — inventories drained, spot premiums exploded.
- Energy cost pass-through: European natural gas at $15/mmbtu (2026f) and Japan LNG at $16/mmbtu feed directly into ammonia and urea production costs.
- Export halt for processed goods: Middle East fertilizer and aluminum shipments stalled alongside crude — a second-order hit to metals and farm inputs.
What Normally Flows Through Hormuz
Picture this: a narrow waterway carrying a large share of seaborne oil, LNG cargoes bound for North Asia, urea and DAP from Gulf petrochemical complexes, and aluminum ingots from energy-intensive smelters. When insurance premiums spike and owners refuse to transit, it is not only Brent that moves — every gas-linked industrial chain reprices within weeks.
From what I’ve seen in past chokepoint episodes, traders who only watch WTI inventory prints miss the fertilizer and aluminum legs until margin calls arrive on unrelated positions.
Why Fertilizers and Metals Moved With Oil
Urea synthesis is gas-intensive. When Gulf exports stop and European gas rallies 25.4% year-on-year to $15/mmbtu, production economics shift overnight. Aluminum smelting faces the same energy bill — plus Middle East export reductions that tighten physical availability even where smelters still run.
Compared to a pure oil supply shock, this one has longer tails into food costs and industrial metals — honestly, that is why the World Bank upgraded the whole complex, not just the energy line.
Energy: Brent $86 Forecast vs $120 Reality
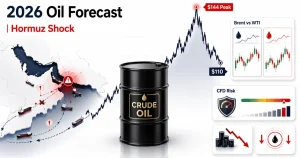
The World Bank’s April baseline forecasts Brent at $86.0/bbl for 2026 — up 24.6% from $69.0 in 2025, with a 2027 retreat to $70.0. On paper that is already a bullish year. Pink Sheet reality in Q2 runs hotter:
| Brent ($/bbl) | Jan–Mar avg | Feb | Mar | Apr |
|---|---|---|---|---|
| Pink Sheet | 80.5 | 71.1 | 103.7 | 120.4 |
March alone added $46/bbl — the largest monthly Brent increase on record per the CMO executive summary. April’s $120.4 average already exceeds the full-year $86 forecast, which means annual averages will be revised again unless prices collapse in H2.
Natural Gas and LNG: Parallel Spikes
European gas is forecast at $15.0/mmbtu (+25.4% YoY) and Japan LNG at $16.0/mmbtu (+32.9%). Australian coal averaged $130.9/mt in April on the Pink Sheet — another energy leg for power and industrial users. If your CFD book includes gas or coal alongside Brent, treat them as one correlated cluster through Q2, not independent mean-reversion trades.
I lean toward watching front-month spreads and Hormuz headlines together — flat price alone misleads when physical premiums detach from futures, as we detailed in the crude oil price forecast 2026 piece.
Upside Risk: $95–$115 if the Strait Stays Shut
The World Bank flags upside risks as dominant. If the Hormuz closure persists, Brent could trade in a $95–$115/bbl range for an extended period — above the baseline $86 but below panic spikes. For CFD traders, that band is a scenario anchor: baseline for planning, upside for risk limits.
Fertilizer Shock: Urea +59.7% and the Second-Largest Monthly Jump in a Decade
Fertilizers are the hidden leverage in this crisis. The World Bank fertilizer index (2010=100) is forecast at 181.3 in 2026 — +30.7% year-on-year. Urea leads:
| Product | Unit | 2025 | 2026f | YoY | 2027f |
|---|---|---|---|---|---|
| Urea | $/mt | 423 | 675 | +59.7% | 500 |
| DAP | $/mt | 685 | 725 | +5.8% | 650 |
Pink Sheet spot data already overshoots the annual forecast: urea averaged $725.6/mt in March and $856.9/mt in April — a monthly jump above 50% in March, part of the second-largest monthly rise in the fertilizer index in ten years.
The Double Hit: Gas Costs and Export Stops
Urea producers face higher feedstock gas at the same time Middle East export volumes disappear from normal trade routes. DAP on the Pink Sheet hit $725.3/mt in April versus a $725 full-year forecast — spot is front-loading the pain.
Honestly, I wouldn’t treat fertilizer CFDs (where available) as slow-moving ag inputs in 2026; they are trading like energy derivatives with a planting-season lag.
Food Prices: Stable Now, Risk Later
The agriculture index is forecast −5.6% for 2026 — grains supply remains geographically diversified, so direct war pass-through is limited near term. The World Bank nonetheless warns that higher fertilizer costs can feed into crop production expenses with a delay — a classic delayed shock into 2027 food balances if the conflict drags.
The World Food Programme estimates that a prolonged conflict could push an additional 45 million people into severe food insecurity — a humanitarian datapoint that also signals political pressure on export bans and stockpiling, which can move soft commodities suddenly.
Base Metals 2026: Copper $12,000 and Aluminum $3,600
The base metals index is forecast at 145.8 (+19.2% YoY). Individual forecasts:
| Metal | Unit | 2025 | 2026f | YoY | 2027f |
|---|---|---|---|---|---|
| Aluminum | $/mt | 2,632 | 3,200 | +21.6% | 3,000 |
| Copper | $/mt | 9,947 | 12,000 | +20.6% | 11,000 |
| Tin | $/mt | 34,059 | 41,000 | +20.4% | 37,000 |
| Nickel | $/mt | 15,162 | 17,000 | +12.1% | 17,500 |
| Iron ore | $/dmt | 100.2 | 97.0 | −3.2% | 95.0 |
Pink Sheet April prints: aluminum $3,600/mt, copper $12,951/mt — both at or above annual forecasts mid-year.
Aluminum: Energy Plus Gulf Export Loss
Aluminum combines Middle East export reductions with smelter energy costs — the CMO highlights both channels. April’s $3,600 spot vs $3,200 forecast is the clearest example of physical tightness outpacing models.
If you’re the type of trader who pairs LME aluminum with Brent, 2026 rewards that correlation monitor — until smelter restarts or demand destruction break the link.
Copper & Tin: Structural Demand Meets Supply Tightness
Copper at $12,000/mt reflects renewable energy, grid build-out, AI data-centre power demand, and constrained mine supply — themes that pre-date the war but accelerate when energy costs reorder industrial priorities. Tin at $41,000/mt adds electronics solder demand into the same basket.
Iron ore is the outlier — forecast −3.2% as Chinese steel demand softens. Against copper, iron ore feels like the wrong hedge for a Gulf shock; personally I’d separate them in risk buckets.
Agriculture: Calm Surface, Fertilizer Undertow
Food commodity prices are comparatively stable — the CMO cites roughly +2% for the food complex in the near term, with diversified grain origins limiting immediate disruption. The agriculture index nonetheless falls 5.6% on the 2010=100 measure because other ag subcomponents weigh differently.
Why Grains Did Not Spike With Brent
Global grain supply is spread across the Americas, Black Sea, and Oceania — not solely through Hormuz. That geographic redundancy buys time. Soft commodity CFD traders should still watch planting decisions and input costs: urea at $857/mt changes farmer economics even if wheat futures look quiet today.
Direct assessment: the calm is real but temporary if fertilizer stays elevated through the northern hemisphere application window.
Oils and Softs: Soybean Oil and Palm Oil Angles
Vegetable oils tie food, biofuel mandates, and freight costs together. When energy spikes, biofuel blending economics shift; when freight reroutes around conflict zones, export parity prices move. For CFD books with soybean oil or palm oil exposure, energy and freight are secondary drivers worth charting alongside crop reports.
Precious Metals: A Separate +42% Index Move
Precious metals sit apart from the Hormuz industrial chain yet dominate the headline index: 368.3 in 2026f, up 42.4% from 258.6 in 2025. Gold, silver, platinum, and palladium each have distinct macro drivers — rate expectations, dollar moves, ETF flows, and industrial subsets — that we cover in dedicated pieces rather than duplicating here.
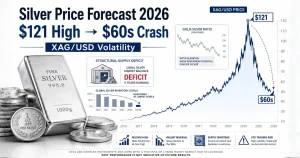
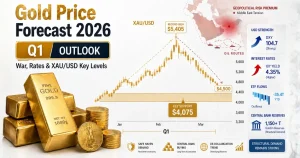
Fact plus verdict: the precious metals index can rise while agriculture falls; cross-commodity indices hide that dispersion. Read the gold price forecast 2026, silver price forecast 2026, and platinum palladium 2026 articles for trade-level detail — especially the “buy the rumour, sell the fact” macro reversal that hit metals after the February conflict despite inflation headlines.
2027 Scenario: Energy −17% if the Worst Quarter Passes
World Bank baseline assumes the most acute phase of the conflict eases after 2026 Q2. Under that path, energy prices fall 17% in 2027 — total index back to 99.8, energy at 92.1, Brent at $70/bbl, urea at $500/mt.
Baseline vs Prolonged Closure
Baseline: normalization, inventories rebuild, fertilizer and metals soften but stay above pre-war levels in several cases. Prolonged Hormuz closure: upside risk dominates — Brent $95–$115, annual averages revised higher, food insecurity risks escalate.
Personally, I treat 2027 forecasts as scenario anchors, not trading signals — the variance between baseline and upside is wider than any year since 2022.
Positioning Into Year-End
CFD traders holding multi-month energy longs should mark where baseline implies mean reversion — $70 Brent in 2027 is a 42% drop from April’s $120 average if it materializes. Metals may not fall as symmetrically: copper structural tightness and precious metals macro bids can decouple from oil retracements.
Practical Takeaways for CFD Commodity Traders
Energy Cluster: Brent, Gas, Coal
Trade the cluster, not a single chart. Brent Apr $120.4, European gas $15/mmbtu, Japan LNG $16/mmbtu — correlations spike in chokepoint weeks. Size down when headline volatility exceeds physical spread moves; use the crude oil price forecast 2026 framework for inventory and spread context.
Metals: Copper & Aluminum Over Iron Ore
Copper and aluminum align with the shock narrative; iron ore does not. Tin adds electronics beta. Watch Pink Sheet monthly prints against CMO annual lines — when spot exceeds forecast by mid-year, models lag reality.
Agriculture: Soybean Oil, Palm Oil, Delayed Fertilizer Pass-Through
Near-term food stability can mask fertilizer-driven cost pressure into the next crop cycle. If urea stays above $700/mt, monitor policy responses (export restrictions, subsidies) that move softs faster than USDA-style reports suggest.
Minimum deposit and leverage vary by broker — the point is cross-margin: an energy long plus aluminum long doubles Gulf exposure without feeling like concentration until both move together.
Summary: One Chokepoint, Many Markets
The commodity market outlook for 2026 is defined by a single geopolitical fracture with multi-market fallout. Brent from $71 to $120, urea +59.7% on forecast, base metals index +19.2%, precious metals +42.4%, agriculture comparatively stable but exposed to delayed fertilizer pass-through — the World Bank’s April CMO captures a cross-asset regime shift, not an oil-only headline.
For CFD traders, the actionable frame is correlation mapping: energy with fertilizers and aluminum; grains decoupled near term; precious metals on macro rails of their own. Track Pink Sheet monthly data against annual forecasts, respect upside $95–$115 Brent scenarios, and use dedicated outlook articles on oil, gold, silver, and platinum and palladium for instrument-level detail. Baseline 2027 normalization is plausible on paper — but 2026 is a live stress test until Hormuz flows normalize.