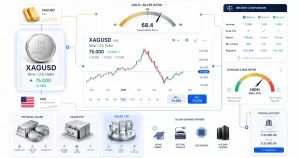




On 29 January 2026, gold and silver both printed all-time highs on the same day — $5,405/oz for XAU/USD and $121.15/oz for XAG/USD. Within weeks, their paths diverged sharply: silver collapsed into the $60s while gold held a comparatively orderly adjustment. That split is not random noise; it reflects structural differences that matter directly for gold vs silver trading and for anyone sizing gold vs silver CFD positions in 2026.
This article uses World Gold Council (WGC) market-structure research from March 2026 and CME Group macro analysis to explain why the two metals behave so differently — demand mix, supply elasticity, liquidity, volatility, crisis correlation, and price discovery — and how to choose between them by scenario. For directional outlooks, see our gold price forecast 2026 and silver price forecast 2026 guides. For the wider 2026 commodity shock, see our commodity market outlook 2026.
Same Label, Opposite Paths After the January Peak
Both metals delivered strong returns over the past year. Silver lagged early in 2025, then surged in late 2025 and outpaced gold by a wide margin — before giving back much of the move in a fraction of the time. Gold’s rally was steadier; silver’s was sharper in both directions.
Personally, I think the January 29 double-ATH is the clearest teaching moment for CFD traders: two instruments under the “precious metals” banner can share a headline date and then trade like different asset classes entirely. If you treat XAG/USD as “gold with extra leverage,” you will mis-size risk and misread spread behaviour when volatility spikes.
Demand Structure: Investment Asset or Industrial Metal?
The end-use mix is the first structural fork. WGC data to December 2025 shows gold demand split roughly as 46% jewellery, 33% investment plus central bank buying (net), and 8% industrial/technology. That balance gives gold a dual nature — consumer good and financial asset — with investment demand dominating in risk-off periods and consumer demand stepping in when growth is healthy.
Silver looks different. In 2025, roughly 61% of demand was industrial/technology, 21% jewellery, and 18% investment (net). The industrial share ties silver to pro-cyclical sentiment — during stress it often trades closer to industrial metals and risk assets than to a pure safe haven.
Why the Split Changes Your CFD Thesis
If your thesis is “inflation + geopolitics = buy precious metals,” gold aligns more cleanly with macro hedging. Silver can win when growth and industrial demand are firm — solar, electronics, and grid build-out — but that same link hurts when PMIs soften or commodity indices de-risk. From what I’ve seen in 2026 so far, silver’s industrial tether explains much of why it sold off harder after the late-January peak even while deficit narratives stayed intact.
Central Banks Buy Gold, Not Silver
Gold’s reserve status adds a floor of official-sector demand that silver simply does not have. Central bank net buying has been a multi-year theme; it reinforces gold’s role as a policy-sensitive financial asset. Honestly, I wouldn’t recommend sizing silver as a “mini gold reserve play” — the demand bases are not comparable.
Supply Risk: Primary Product vs By-Product
Supply-side asymmetry is equally important. Gold is mined primarily as a primary product, with production geographically dispersed across Latin America, Asia, Africa, Europe, the CIS, and North America — no single region dominates the top-ten list.
Silver is different: WGC estimates 70–80% of mined silver comes as a by-product of copper, lead, and zinc operations. Output therefore depends on base-metal economics and grades, not silver spot alone. Geographic concentration is sharper too — Mexico ranks first, Peru third, Bolivia fourth, and Chile sixth among top producers, with Mexico alone producing nearly twice China’s volume.
Recycling: Stable Gold, Tighter Silver
Recycling contributes roughly one-third of global gold supply versus about 19% for silver. Because so much silver sits in solar panels, electronics, and dispersed industrial uses, recovery is often uneconomical. Gold benefits from a more stable secondary supply; silver faces structurally tighter physical conditions when investment and industrial demand collide — as they did in late 2025 and January 2026.
What This Means for Spread Spikes
By-product inelasticity plus LatAm concentration is a recipe for violent short-term squeezes followed by sharp reversals when leveraged longs exit. Compared to gold’s deeper physical pipeline, silver’s supply chain has less slack — and CFD traders feel that first in the bid-ask, not in the annual mine report.
Market Size and Liquidity: Spread Reality for XAU vs XAG
Gold is a deep market — WGC estimates roughly $15 trillion in financial form, mostly physical bullion — with trading activity comparable to major bond and currency markets. Silver’s market is materially smaller across every channel.
| Channel (5-yr avg daily) | Gold | Silver |
|---|---|---|
| Physically backed ETFs | $2.3 bn | $0.7 bn |
| COMEX futures | $55 bn | $11 bn |
| LBMA OTC | $97 bn | $13 bn |
Momentum in late 2025 and early 2026 lifted volumes further. Through February 2026, silver ETF turnover reached $11.4 bn/day — nearly nine times the FY25 average — while silver futures jumped to $71 bn/day (four times FY25). Gold volumes rose too, but the proportional surge in silver reflects how thin markets amplify trend-chasing flows.
Intraday Spreads: 2.3 bps vs 9.3 bps (Max 125 bps)
Trading volume alone can mislead; intraday bid-ask spread is a cleaner depth gauge. WGC analysis from February 2025 to February 2026 shows gold averaging 2.3 basis points (max 11.0 bps) versus silver at 9.3 bps average and a 125.3 bps maximum. Silver spreads blow out in risk-off episodes — liquidation cost jumps precisely when you need to exit.
The spread is too wide for scalping silver like gold — here’s why that matters: a 50–125 bps slip on a leveraged CFD can erase a “correct” directional call. If you’re the type of trader who relies on tight entries and quick stops, gold’s microstructure is simply more forgiving.
Index Open Interest: Silver’s 6.4% Vulnerability
Broad commodity index open interest as a share of metal futures OI is 1.2% for gold versus 6.4% for silver (five-year average). Silver is more exposed to index-led de-risking — when commodity benchmarks sell, silver can take a disproportionate hit even if its own fundamentals haven’t changed.
Volatility and Position Sizing: Same Notional, Different Risk
Wider spreads feed higher volatility. Since 1991, WGC data shows silver’s annualised daily volatility runs at roughly double gold’s. In risk-parity frameworks, equal risk contribution requires a materially smaller silver notional than gold — often less than half on a like-for-like basis.
Practical CFD Sizing Rule of Thumb
If you normally trade 1.0 lot equivalent on XAU/USD, treating XAG/USD at the same lot size doubles your volatility budget and quadruples your spread risk — before leverage. Personally, I lean toward 0.3–0.5x the gold notional for silver when targeting similar peak-to-trough pain, then adjust for session liquidity (London/NY overlap vs Asian thin hours).
Beta 1.3: Silver Amplifies Gold’s Moves
Silver’s long-run beta to gold clusters around 1.3, with sensitivity often higher when gold falls than when it rises. That asymmetry means silver is a tactical amplifier — not a substitute for gold’s steadier profile. The gold silver ratio 2026 compressed violently into January (below 45:1 at the peak) and widened again as silver crashed — ratio trades carry their own spread and gap risk.
Crisis Behaviour: Which Metal Diversifies?
Both metals sit in precious-metals benchmarks, but portfolio behaviour diverges in stress. Gold has historically shown negative correlation to equities during large drawdowns — supporting its hedge role. Silver does not consistently offer the same protection; in risk-off environments it often behaves more like a cyclical asset, limiting stabilisation benefits.
The 2026 War Paradox (CME)
CME Group analysis notes a puzzle: Middle East conflict from 28 February 2026 should have been bullish for precious metals as safe havens, yet gold, silver, platinum, and palladium all fell. Drivers included repriced rate expectations (“buy the rumour, sell the fact” on inflation), a rebounding US dollar as flight-to-quality, and portfolio de-risking. Precious metals are typically negatively sensitive to expected rate hikes — when inflation crystallises and central banks talk tightening, metals can fall despite the headline risk.
Risk-Adjusted Returns: Gold Wins Over 20 Years
WGC hypothetical portfolio work (2006–2025) shows adding gold improved risk-adjusted returns more than an equivalent silver allocation. Gold delivered steadier diversification; silver added return potential with higher drawdown variance. For crisis hedging, gold is the cleaner instrument — silver is the higher-octane satellite.
Price Discovery: Gold Leads, Silver Follows
Granger-causality tests on intraday returns (1999–2026, controlling for the US dollar) show gold → silver is significant at the 1% level, while silver → gold is not significant. Gold acts as the information anchor; silver adjusts as a higher-beta satellite. A cyclical silver selloff does not necessarily infect gold — but gold’s direction still sets the tone for silver CFD setups.
Trading the Anchor, Not the Echo
Picture this: gold stalls at a macro level while silver overshoots on momentum flows, then mean-reverts twice as fast. If you trade silver without watching XAU/USD structure, you’re trading the echo without the signal. I prefer establishing a gold view first — trend, levels, rate/USD context — then deciding whether silver’s beta justifies a satellite leg.
Contagion Is One-Way
WGC emphasises gold’s relative immunity to silver contagion. Industrial or index-driven silver selloffs can be violent and localised; gold’s reserve demand and deeper liquidity absorb shocks more evenly. That asymmetry should inform which instrument you hold through a weekend gap versus which you trade intraday only.
Practical Takeaways for Gold vs Silver CFD Traders
Scenario selection matters more than picking a “winner” between the two metals.
- Safe-haven / macro hedge: favour XAU/USD — tighter spreads, lower vol, equity diversification track record
- Risk-on / industrial cycle: silver can outperform when PMIs and base metals are firm — but size down and expect slippage
- Short-term momentum / squeeze plays: silver offers larger swings; require wider stops, smaller lots, and session awareness
- Ratio trades (XAU/XAG): powerful but spread-sensitive — both legs can gap; gold leg usually fills more reliably
Checklist Before You Open Either CFD
Minimum deposit accessibility is similar across brokers, but execution is not. Before entry: (1) compare quoted spread to WGC averages, (2) map Fed/ECB rate expectations — see CME’s rate-de-pricing narrative, (3) check DXY direction, (4) note commodity index flows, (5) set notional so a 2σ silver day does not breach your daily loss limit. Against XM or any broker, gold and silver CFD specs differ on contract size and swap — verify both.
When to Hold Both
A core-satellite split fits the data: strategic gold allocation for structure, tactical silver for beta when gold confirms direction and industrial demand supports the cycle. Holding equal notional in both is the most common sizing mistake I see — it overweights silver risk by construction.
Summary: Strategic Core (Gold) vs Tactical Satellite (Silver)
Gold and silver share a precious-metals label but diverge on demand mix, supply elasticity, liquidity, volatility, crisis correlation, and price discovery. The January 2026 episode — twin ATHs, then silver halved while gold corrected orderly — is the market teaching the same lesson WGC quantifies in spreads, volumes, and betas.
For gold vs silver trading and precious metals volatility management in 2026, treat gold as the strategic core for macro and diversification, and silver as a tactical satellite when you deliberately want amplified moves — with smaller size, wider stops, and eyes on XAU/USD first. Same category, different instruments: your CFD workflow should reflect that split.