




Gold (XAUUSD) is one of the few markets where seasonal anomalies are structurally driven rather than random noise. January averages +5% over the past 20 years. September closes bearish 90% of the time over the past decade. Asian session buying routinely fades when London and New York open. These gold price seasonality patterns persist because they are rooted in predictable physical demand cycles, institutional repositioning, and the structural divide between Eastern physical buyers and Western paper sellers — not coincidence.
This guide breaks down every major gold anomaly — monthly, day-of-week, intraday, and event-driven — with the structural reasons behind each, so you can incorporate them into your trading with realistic expectations.
Seasonal Anomalies: Gold’s Annual Price Cycles
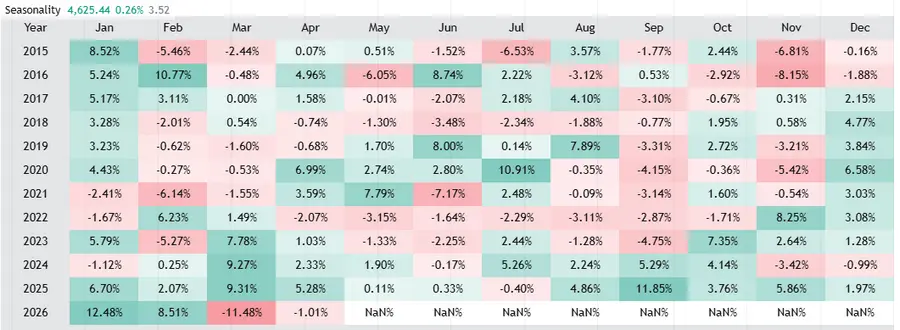
Gold shows clear seasonal tendencies across the calendar year. The strongest month is January (averaging +5% over 20 years); the weakest is September (90% bearish over the past decade) — two anomalies with among the highest reproducibility in the gold market.
Monthly Patterns at a Glance
Based on 20+ years of historical data, the months with the most consistent anomalies are:
| Month | Tendency | Primary Driver |
|---|---|---|
| January | Strongest (avg. +5%) | Chinese New Year preparations, institutional rebalancing at year-start |
| June | Weakest candidate (avg. −0.4%) | Summer doldrums — low physical and speculative demand |
| August | Strong | Early autumn rally positioning |
| September | 90% bearish over past 10 years | Profit-taking after July–August run-up |
| Nov–Dec | Strong (Dec avg. +1.5%) | Year-end rally, Western jewellery demand |
Gold’s Seasonal Cycle: Four Phases Per Year
Averaging 20 years of gold price data reveals four repeating phases within each calendar year:
October to Mid-April: Strong Bull Phase
- October–December: India’s wedding season + Diwali drive a surge in physical gold demand
- November–December: Christmas and year-end Western jewellery buying
- December–February: Chinese New Year (Spring Festival) preparations — large-scale physical buying
- January–February: Institutional portfolio rebalancing at year-start — increased gold allocation
→ Physical demand from multiple regions overlaps, creating a demand “golden window”
Mid-April to July: Weak / Sideways Phase
- India’s wedding season ends, physical demand drops into a trough
- “Sell in May” equity market dynamics draw investment money away from gold
- Institutional summer holidays reduce volume and directional momentum
→ Both physical and speculative demand thin out simultaneously — a demand vacuum
July to August: Recovery / Pre-Positioning Phase
- Early buying ahead of India’s Diwali + wedding season starting in October
- Jewellery manufacturers build inventory ahead of peak season
- China’s Mid-Autumn Festival (September) preparations begin
→ Pre-autumn rally “loading phase” as demand expectations build
September: The Weakest Month (90% Bearish in Past Decade)
- Profit-taking after the July–August run-up
- Temporary demand pause before Diwali season proper begins
- Institutional portfolio trimming before September fiscal year-end
The Year-End Rally: November to February
The four-month stretch from November through February is known as gold’s most reliable seasonal window. Indian wedding season and Diwali, Christmas jewellery demand, and Chinese New Year physical buying all converge in a relatively short period — creating a consistent upward bias backed by structural rather than speculative forces.
Day-of-Week Anomaly: Monday Weakness, Friday Strength
Among day-of-week effects in gold, the best-known pattern is Monday weakness and Friday strength. Historical data across 20+ years shows Mondays trending bearish and Fridays trending bullish more frequently than other days.
Why This Pattern Exists
The mechanism is widely attributed to institutional hedging: large players buy gold on Friday to hedge against geopolitical and macro risks that could develop over the weekend, when markets are closed. That concentrated Friday buying creates the positive Friday bias — and the subsequent Monday profit-taking creates the negative Monday bias.
Academic Research: The Pattern Is Weakening
Multiple studies suggest the traditional Friday-Monday gold anomaly has evolved significantly:
- A 2011 study found that the classical weekend effect (Friday gains, Monday losses) no longer existed in gold and crude oil markets — replaced by a “Thursday effect”
- A 2016 study confirmed that in London and New York markets, the weekend effect now tends to start mid-week (Wednesday–Thursday)
- Research on the Shanghai Gold Exchange found the reverse pattern: Monday bullish, Tuesday bearish — reflecting different market structure and liquidity dynamics in Asia
The takeaway: simple “sell Monday, buy Friday” strategies are unlikely to work mechanically. Day-of-week tendencies are best used as one filter among several — combined with trend direction, session context, and other signals.
Intraday Anomaly: East Buys Physical, West Sells Paper
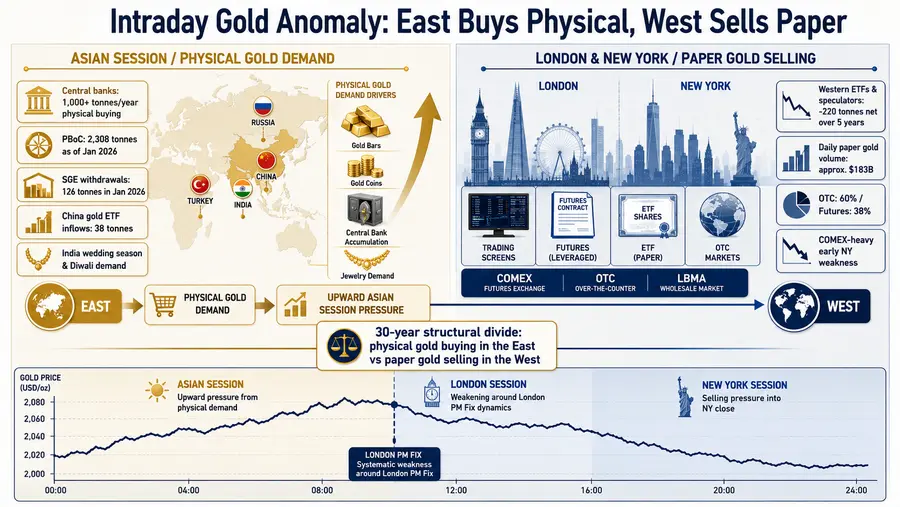
The most well-known intraday gold anomaly is the “rises in Asia, falls in London and New York” pattern — observed consistently for over 30 years. The structural explanation is a fundamental divide between how Eastern and Western markets trade gold.
Asian Session: Structural Physical Demand
Eastern markets are dominated by physical gold buying:
- People’s Bank of China (PBoC): 2,308 tonnes as of January 2026, representing 9.6% of foreign reserves — and still buying
- Shanghai Gold Exchange (SGE): January 2026 withdrawals of 126 tonnes; Chinese gold ETF inflows of 38 tonnes (record year-start)
- India: Wedding season (October–December) and Diwali generate world-class physical demand year after year
Structural physical premiums in China and India create persistent upward pressure during Asian trading hours.
London and New York: Paper Gold Dominates
The London OTC market and COMEX futures are primarily paper gold — contracts with minimal physical backing. Daily trading volume is approximately $183 billion, with OTC accounting for 60% (London: 58% of that) and futures 38% (COMEX: 80% of that).
Since August 5, 1993 — when gold dropped $10 “within seconds” of the New York COMEX open — a pattern of early-NY-session weakness has been repeatedly observed.
Statistically Confirmed
German mathematician Dimitri Speck averaged five years of one-minute gold price data and found a clear, systematic downward tendency around the London PM Fix (midnight Tokyo time in winter / 11pm in summer) — a pattern that appears in the averaged data with striking regularity.
Why It Happens — Competing Theories
- Manipulation theory: Bullion banks short COMEX heavily, using paper gold to satisfy Asian physical demand while managing London gold flows
- Institutional theory: New York institutions move at the 10am open, and equity market reversals spill into gold
- ETF hedging theory: Authorized participants in gold ETFs apply hedging pressure that coincides with Western session opens
Trading the East-West Structural Divide
Much of gold’s intraday behavior can be explained by a 30-year-old structural divide: physical gold bought in the East, paper gold sold in the West. Asian session uptrends, London/NY selling pressure, and the systematic weakness around the London PM Fix are all expressions of the same underlying market structure — repeating patterns that arise not from individual news events but from how the gold market is fundamentally organized.
Event-Driven Anomalies: Presidential Cycle, Geopolitics & COMEX Month-End
Beyond calendar and intraday patterns, gold shows repeating behaviour around specific events — most notably the US presidential cycle, geopolitical shocks, and COMEX month-end positioning.
US Presidential Cycle: Midterm Year Is Strongest for Gold
Analyzing data from 1973 to 2019, gold’s best year in the four-year presidential cycle is the midterm election year — averaging +12.89%. The election year itself averages +12.76%, the pre-election year +12.02%, and the post-election year is the weakest.
Election outcomes also influence gold in the short term. Since 1980, from election day to inauguration day: a Democratic win has averaged +1.5% for gold; a Republican win has averaged −5.5%. The Republican fiscal discipline and strong-dollar stance tend to weigh on gold, while Democratic outcomes often coincide with fiscal expansion — historically supportive for the metal.
Geopolitics: From Panic Buying to Central Bank Accumulation
Gold has traditionally been the go-to safe haven during geopolitical crises. But the pattern has changed.
Recent events — Russia’s invasion of Ukraine in 2022 (spike to $2,070, then quick retreat), the Middle East escalation from 2023, and ongoing US-China trade tensions — have all produced shorter-lived gold spikes than historical crises. The “buy on geopolitical shock” trade now fades faster than it used to.
The reason is a structural shift in who is buying. After the 2022 Russia sanctions froze roughly half of Russia’s foreign reserves, emerging market central banks began reducing dollar and euro exposure and accumulating physical gold — stored in their own vaults, immune to foreign seizure. Central bank gold buying since 2022 has been more than double the 2015–2019 average. By 2024, central banks accounted for approximately 25% of total global gold demand.
The main buyer has shifted from retail panic to central bank accumulation. Short-term geopolitical spikes are weaker, but the long-term structural bid is stronger than at any point in recent decades.
COMEX Month-End and Quarter-End Patterns
Gold tends to move more aggressively around month-end and quarter-end dates, when COMEX options settlements concentrate. The London PM Fix window (midnight Tokyo time in winter / 11pm in summer) frequently sees sharp moves — both spikes and drops — in the days surrounding these dates.
Knowing that month-end periods carry elevated volatility allows traders to widen stops appropriately and avoid being stopped out by positioning-driven noise rather than genuine directional moves.
Related Articles
- How to Trade Gold (XAUUSD): Essential Knowledge for Getting Started
- Gold Trading Strategy (XAUUSD): Price Drivers and Profitable Approaches
- Gold Trading Risks: 7 Critical Hazards That Destroy Accounts
FAQ