



“When the dollar goes up, gold goes down.” It’s one of the most widely repeated rules in macro investing — and over the past decade, the data broadly supports it. But a closer look at 10 years of DXY-versus-gold returns reveals several striking moments where the gold dollar correlation breaks down entirely. Far from being noise, these breakdowns are among the most important signals in precious-metals analysis.
This article examines the structural mechanics behind the gold–USD inverse relationship, verifies it with annual data from 2016 to 2025, and then digs into the monthly breakdown patterns from 2023 through mid-2026. You’ll also find a set of complementary indicators — central bank purchases, ETF flows, multi-currency gold prices, and key ratios — that help confirm whether the correlation is holding, bending, or snapping.
Why Gold and the Dollar Move Inversely — The Structural Explanation
Gold is globally priced in US dollars. The London Bullion Market Association (LBMA) benchmark, COMEX futures, and the spot XAU/USD pair all quote gold per troy ounce in USD. This creates an automatic, mechanical link: when the dollar strengthens, a single USD buys more gold, so the USD-denominated price tends to fall — even if nothing about gold’s fundamental demand has changed.
Consider a concrete example. If EUR/USD drops from 1.10 to 1.00 — a roughly 9 % dollar rally — a European buyer who was paying €1,818 per ounce at $2,000/oz now pays €2,000 for the same ounce. The dollar price of gold hasn’t moved, yet the cross-currency arithmetic alone creates downward pressure on XAU/USD as relative purchasing power shifts.
This is the baseline correlation. It’s real, it’s persistent, and in “normal” years it explains most of gold’s directional moves. The real analytical value, however, lies in spotting when this automatic mechanism is overwhelmed — when gold rises despite a strengthening dollar, or surges far more than the dollar’s decline would justify. Those are the moments that reveal genuine buying pressure beneath the surface.
A note on DXY: The US Dollar Index (DXY) measures the dollar against a basket of six major currencies — EUR (57.6 %), JPY (13.6 %), GBP (11.9 %), CAD (9.1 %), SEK (4.2 %), and CHF (3.6 %). Because of its heavy EUR weighting, DXY can rise even when the dollar is broadly weakening, simply because the euro is weakening more. DXY is a useful proxy, but it is not “the dollar” itself.
10-Year Data Verification — Gold Dollar Correlation Breakdowns Signal Strong Buying Pressure
DXY vs Gold Annual Returns (2016–2025)
The table below shows the annual percentage return for the ICE US Dollar Index (DXY) alongside the LBMA gold spot price (USD/oz) for each calendar year. The “Direction” column flags whether the two moved inversely (as expected), in the same direction (a breakdown), or whether one was essentially flat.
| Year | DXY Return | Gold Return | Direction |
|---|---|---|---|
| 2016 | +3.81 % | +8.5 % | Same direction ⚠️ |
| 2017 | −10.03 % | +13.1 % | Inverse ✔️ |
| 2018 | +4.40 % | −1.5 % | Inverse ✔️ |
| 2019 | +0.23 % | +18.2 % | DXY flat |
| 2020 | −6.69 % | +25.0 % | Inverse ✔️ |
| 2021 | +6.37 % | −5.9 % | Inverse ✔️ |
| 2022 | +8.21 % | −0.2 % | Inverse ✔️ |
| 2023 | −2.12 % | +13.5 % | Inverse ✔️ (scale anomaly) |
| 2024 | +7.07 % | +27.2 % | Same direction ⚠️ |
| 2025 | −9.41 % | +60 %+ | Inverse ✔️ (scale anomaly) |
DXY = ICE US Dollar Index annual return. Gold = LBMA gold spot price (USD/oz) annual return. Sources: ICE, LBMA, TradingView.
Normal Years Follow the Textbook
2017, 2018, 2020, 2021, and 2022 are textbook examples. When DXY rose, gold fell; when DXY fell, gold rose. The magnitudes weren’t always proportional, but the directional relationship held cleanly. These are the years that justify the conventional wisdom.
2019 is a borderline case — DXY barely moved (+0.23 %), effectively flat, while gold rallied 18 %. With the dollar on the sidelines, gold’s rise reflected its own demand drivers (rate-cut expectations, trade-war uncertainty) rather than any dollar weakness.
The breakdown Years Reveal the Real Gold Bull Trend
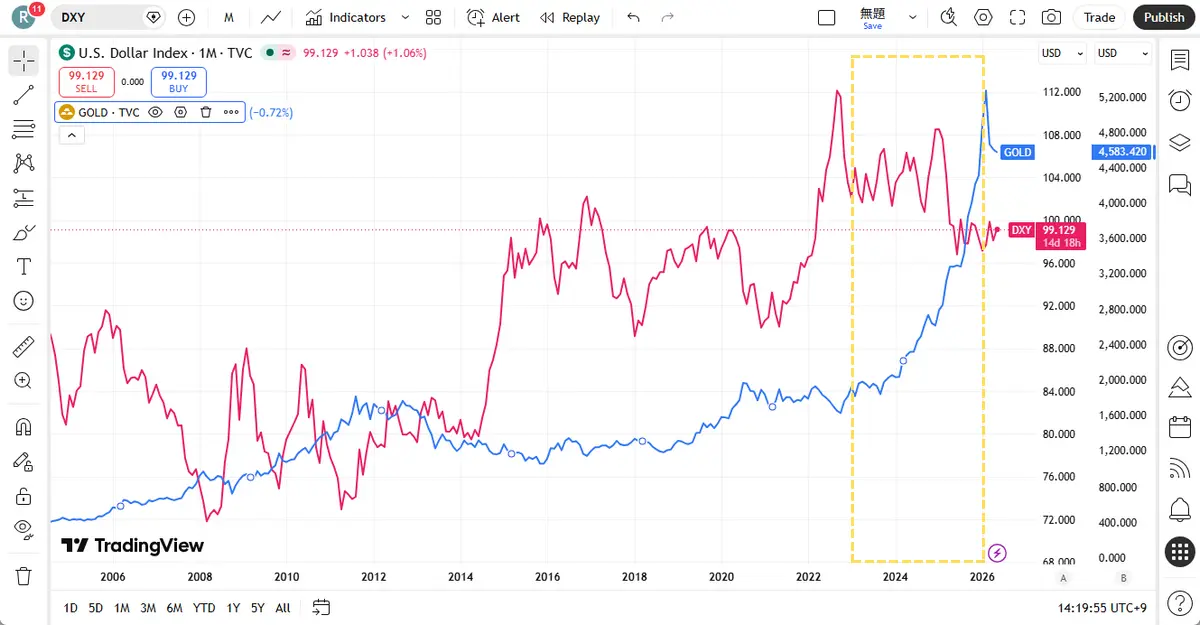
Three periods stand out — not because the correlation reversed perfectly, but because gold’s strength was far too large to be explained by dollar movements alone.
2023 — Inverse, but anomalous in scale. DXY fell just 2 %, yet gold surged 13.5 %. A modest dollar decline should have produced a modest gold rise — not a double-digit gain. The excess buying power came from the SVB banking crisis in March (which triggered safe-haven demand), continued fallout from the Russia–Ukraine war, and an acceleration in central bank gold purchases that had begun in 2022.
2024 — Full breakdown. This is the clearest anomaly in the dataset. DXY rose 7 % — a strong dollar year — yet gold climbed 27 %. The structural inverse correlation says gold should have fallen. Instead, record-setting central bank purchases (led by the People’s Bank of China, National Bank of Poland, and Reserve Bank of India), rising Middle East geopolitical risk, and institutional portfolio rebalancing overwhelmed the dollar headwind entirely.
2025 — Inverse, but anomalous in scale. DXY dropped about 9 %, which would normally support a gold rally of perhaps 10–15 %. Instead, gold gained over 60 %. The excess was driven by Trump’s second-term tariff escalations, deepening US fiscal-deficit concerns, record institutional ETF inflows, and continued central bank diversification away from USD reserves.
The takeaway across all three years is the same: when gold rises despite DXY headwinds — or rises far beyond what DXY weakness would justify — it signals buying pressure that overwhelms the structural correlation. These breakdowns don’t appear randomly. They cluster around major macro regime shifts, and they have been the defining feature of the 2023–2025 gold bull market.
2023–2026 Monthly Breakdown Analysis — Where the Gold vs DXY Correlation Stands Now
Annual data shows the big picture, but monthly data reveals the rhythm. Below is a month-by-month classification of DXY-versus-gold behaviour from January 2023 through May 2026, using a five-tier system:
- Ultra-bullish: DXY rises, yet gold surges — the strongest possible buying-pressure signal.
- Mildly bullish: DXY falls or is flat, and gold rises — the expected direction, but confirms positive momentum.
- Normal: Textbook inverse correlation — nothing unusual.
- Mildly bearish: DXY falls or is flat, and gold falls — unexpected weakness.
- Ultra-bearish: DXY rises, and gold drops sharply — the strongest selling-pressure signal.
| Period | DXY Move | Gold Move | Classification |
|---|---|---|---|
| 2023 Jan–Mar | −1.3 % | +8.0 % | Mildly bullish |
| 2023 Apr–Jun | +0.3 % | +5.6 % | Ultra-bullish |
| 2023 Jul–Sep | +3.2 % | −3.7 % | Normal |
| 2023 Oct–Dec | −4.6 % | +11.6 % | Mildly bullish (anomalous scale) |
| 2024 Jan–Mar | +3.1 % | +8.1 % | Ultra-bullish |
| 2024 Apr–Jun | +0.4 % | +4.5 % | Ultra-bullish |
| 2024 Jul–Sep | −4.8 % | +13.2 % | Mildly bullish (anomalous scale) |
| 2024 Oct–Dec | +7.7 % | −0.5 % | Normal |
| 2025 Jan–Mar | −3.9 % | +19.0 % | Mildly bullish (anomalous scale) |
| 2025 Apr–Jun | −4.5 % | +12.8 % | Mildly bullish (anomalous scale) |
| 2025 Jul–Sep | +0.5 % | +22.3 % | Ultra-bullish |
| 2025 Oct–Dec | −1.5 % | +10.1 % | Mildly bullish (anomalous scale) |
| 2026 Jan–Mar | +1.8 % | +8.7 % | Ultra-bullish |
| 2026 Apr–May | −0.6 % | +1.2 % | Mildly bullish (fading momentum) |
May 2026 — The Breakdown Is Fading
As of mid-May 2026, gold trades near $4,725/oz and DXY sits at approximately 97.91. Both are range-bound. The 30-day rolling correlation between DXY and XAU/USD has weakened to around −0.25 — well above the long-term baseline of roughly −0.45. In practical terms, this means the dollar and gold are moving somewhat independently of each other, but neither is showing the explosive divergence that characterized the ultra-bullish quarters of 2024 and 2025.
This doesn’t mean the bull market is over — gold at $4,725 is already a historic high — but the energy that drove the breakdowns appears to be dissipating. Two scenarios to watch going forward:
- If the breakdown strengthens again (gold rallies while DXY holds steady or rises) → renewed bullish pressure, likely from another macro catalyst (escalating trade wars, sovereign debt concerns, renewed central bank buying acceleration).
- If the correlation normalizes below −0.70 → the structural shift concludes, and gold returns to trading as a conventional dollar-denominated commodity. Future moves would then depend more on DXY direction.
Beyond DXY — Other Indicators of Gold’s Strength
DXY is the most-watched input, but it’s far from the only one. When assessing whether a gold move is sustainable, check these four complementary signals.
Central Bank Gold Purchases
Central banks have been net buyers of gold every year since 2010, with purchases accelerating sharply after 2022. The People’s Bank of China, National Bank of Poland, Reserve Bank of India, and Central Bank of Turkey have been among the most active. When central bank buying is strong, it provides a floor under gold prices that is largely independent of currency movements. The World Gold Council’s monthly reserve statistics are the best publicly available tracker.
Gold ETF Inflows
Exchange-traded fund flows reflect institutional and retail investment demand. When global gold ETFs (SPDR Gold Shares, iShares Gold Trust, and regional equivalents) see sustained inflows, it signals that investors are actively allocating capital to gold — not just speculating on futures. Track GLD’s total holdings in tonnes via MacroMicro’s GLD holdings chart.
Multi-Currency Gold Prices
Because gold is priced in USD, its performance in other currencies can differ significantly. Gold may be flat in USD terms but hitting all-time highs in EUR, GBP, or JPY — which matters enormously for investors outside the dollar zone. The World Gold Council’s multi-currency gold price data lets you check performance in your local currency and understand whether a “weak gold” narrative in USD is misleading for your region.
Gold/S&P 500 Ratio and Gold/Silver Ratio
The Gold/S&P 500 ratio measures gold’s relative performance against equities. A rising ratio means gold is outperforming stocks — a signal of risk aversion or a structural shift in capital allocation. Track it on MacroMicro’s Gold/S&P 500 ratio chart.
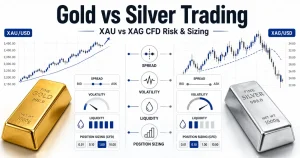
The Gold/Silver ratio measures how many ounces of silver one ounce of gold can buy. Historically, a ratio above 80 signals extreme fear or gold overvaluation relative to silver; below 60 suggests risk appetite is returning. The current ratio provides context for whether gold’s rally is broad-based (silver following) or isolated (gold alone). See the MacroMicro Gold/Silver ratio chart.
Related Articles
- How to Start Trading Gold (XAUUSD) — A Beginner’s Guide
- Gold Trading Strategies — Price Action and Proven Techniques
- Risks of Gold CFD Trading — What You Need to Know
FAQ