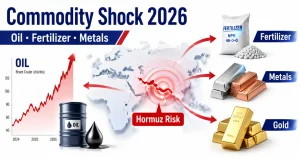




In January 2026, platinum touched $2,860/oz and palladium peaked above $2,100/oz — both all-time highs within the platinum group metals (PGM) complex. By March, platinum had slipped below $2,000/oz as Brent crude rallied roughly 55% after conflict broke out on 28 February while platinum fell about 16%. That divergence makes any serious platinum and palladium price forecast for 2026 as much about macro positioning as about mine supply.
This article uses WPIC Platinum Quarterly Q1 2026, Johnson Matthey’s PGM Market Report 2026, and CME Group macro analysis to explain why the two metals peaked together yet face different structural stories — four years of platinum deficits versus palladium’s Russia tariff shock and battery-electric vehicle (BEV) headwinds — and what that means for platinum CFD trading and palladium exposure. For broader precious-metals context, see our gold price forecast 2026, silver price forecast 2026, and gold vs silver trading guides.
Platinum & Palladium Price Forecast 2026: Two ATHs, One Macro Shock
PGMs sit in gold’s shadow on most CFD platforms, yet 2025–2026 delivered drama worthy of the headline metals. From early 2025 through late January 2026, the same macro cocktail lifted the complex: above-target core inflation, central banks cutting rates despite sticky prices, large fiscal deficits, geopolitical risk, and concern that monetary authorities might fund deficits with easy money.
The turn came fast. Kevin Warsh’s nomination to lead the Federal Reserve — markets read him as independent and sceptical of quantitative easing — undermined the “Fed loses independence” pillar that had supported precious metals. Then the 28 February conflict repriced energy inflation, revived rate-hike talk, and sent the US dollar higher. CME economist Erik Norland describes the pattern as classic “buy the rumour, sell the fact”: metals rally on fear of inflation, then struggle when inflation forces tighter policy expectations. Against gold and silver, platinum and palladium are thinner and more industrial — so the reversal hit harder in percentage terms.
Platinum vs Palladium: Same PGM Family, Different Engines
Both metals share a geological family and often move together in risk-on/risk-off bursts. Structurally, they are not interchangeable.
Platinum: Multi-Sector, Deficit-Prone
Platinum feeds automotive catalysts (especially diesel), jewellery, broad industrial uses (glass, chemicals, electronics), and investment. WPIC’s 2025 demand mix shows automotive at 3,031 koz, jewellery at 2,214 koz, industrial at 2,049 koz, and investment at 1,136 koz. The market has posted four consecutive annual deficits through 2025, with 2026 still forecast in deficit despite a narrower gap.
Personally, I lean toward treating platinum as a hybrid: part precious-metal macro play, part industrial commodity tied to autocatalyst and green-hydrogen capex. That mix explains why it can tag $2,860 on fear trades yet still sell off when real yields rise.
Palladium: Gasoline Autocatalyst, Russia-Linked
Palladium is concentrated in gasoline three-way catalysts (TWC). JM notes palladium surged in January above $2,100/oz, but the 2026 narrative is messier: 2025 was in deficit across PGMs, yet JM flags a possible supply surplus in 2026 as recycling rises and BEV penetration slowly erodes gasoline fleet growth.
Compared to platinum’s hydrogen and glass story, palladium’s long-term risk is structural demand erosion — not a single quarterly inventory print. If you’re the type of trader who only watches dollar gold, palladium’s gasoline dependency and Russian supply politics are easy to miss until spreads blow out.
Platinum: Four Years of Deficit and January’s Record Price
WPIC’s balance table (thousand troy ounces, koz) tells the structural story:
| Year | Total Supply | Total Demand | Balance |
|---|---|---|---|
| 2022 | 7,378 | 6,430 | +949 (surplus) |
| 2023 | 7,135 | 7,933 | −799 |
| 2024 | 7,323 | 8,355 | −1,033 |
| 2025 | 7,240 | 8,431 | −1,191 |
| 2026f | 7,377 | 7,674 | −297 |
2025’s −1,191 koz deficit was the largest in the four-year run; 2026 is forecast to narrow to −297 koz but remains in deficit for a fifth year if the forecast holds. That is compatible with a record spot price in January — paper markets often lead physical tightness, and deficits accumulate in above-ground stocks and lease markets before they show up as empty shelves.
Q1 2026: Surplus Quarter, Not Trend Reversal
WPIC reports Q1 2026 at a +268 koz surplus, driven by 225 koz of ETF outflows and mine supply up roughly 18% year-on-year in the quarter. South African output jumped 41% YoY in Q1 without flood disruptions — a one-off supply pulse that can pressure price even while the full-year balance stays negative.
The spread is too wide for scalping on platinum during macro weeks — here’s the point: a quarterly surplus does not cancel a multi-year deficit narrative; it explains why price could fall 16% while Brent rose 55% in the same geopolitical window.
Demand Shifts in 2026f
| Segment | 2025 (koz) | 2026f (koz) | Change |
|---|---|---|---|
| Automotive | 3,031 | 2,959 | −72 |
| Jewellery | 2,214 | 1,958 | −256 |
| Industrial | 2,049 | 2,238 | +189 |
| Investment | 1,136 | 519 | −618 |
Jewellery and investment are forecast to give back demand at these price levels, while industrial partially offsets. Automotive is nearly flat — diesel and hybrid loadings still matter. From what I’ve seen in prior PGM cycles, when investment demand drops 600+ koz in the forecast, ETF flows deserve more attention than mine headlines for the next quarter.
New Platinum Demand: Hydrogen, Glass, and AI-Driven HDD
Industrial demand is the growth pocket in WPIC’s 2026f breakdown:
- Chemical: 612 koz
- Glass: 377 koz
- Medical: 332 koz
- Petroleum: 132 koz
- Electrical: 119 koz
- Hydrogen: 69 koz
- Other: 598 koz
Hydrogen: Small Tonnes, Large Narrative
Hydrogen-related platinum demand is still modest in koz terms — 40 koz in 2024, 65 koz in 2025, 69 koz in 2026f — but the growth rate matters for long-dated sentiment. PEM electrolysers and fuel cells remain platinum-intensive in many designs; policy support for green hydrogen can move ETF and equity proxies well before physical offtake shows up in WPIC tables.
Honestly, I wouldn’t size a platinum CFD purely on hydrogen headlines in 2026 — the tonnage is too small today — but ignoring it means missing why industrial demand is forecast up 189 koz while jewellery fades.
Electrical & HDD: AI Data-Centre Angle
WPIC highlights electrical demand rising about 25% YoY in Q1 2026, with heat-assisted magnetic recording (HAMR) hard drives for AI and data-centre build-outs cited as a driver. That is a different channel from autocatalysts — more aligned with tech capex than with fuel prices.
Against palladium’s gasoline story, platinum’s HDD and glass segments give it a foot in both energy-transition and digital-infrastructure themes — useful when splitting PGM exposure inside a broader metals book.
Palladium Price Outlook: Russia Shutout and BEV Headwinds
JM’s 2026 palladium view is dominated by trade policy and powertrain shifts rather than a single quarterly balance line.
US Tariffs and the China Redirect
Russian palladium is effectively locked out of the US market: JM cites 133% anti-dumping duties plus 109% countervailing duties under preliminary rulings, following US industry claims of injury from Russian supply. Russian metal flows increasingly to China; Norilsk Nickel’s reliance on China and Hong Kong distribution has risen sharply.
Picture this: US auto makers scramble for non-Russian units while Chinese buyers absorb discounted Russian flows — regional prices can diverge even when the global headline spot looks unified on a screen.
Norilsk Output and Depleted Inventories
JM expects Norilsk Nickel output down about 10% in 2026f and notes Russian refined inventories are thought to have been depleted over the past three years. WPIC separately shows Russian platinum supply easing from 677 koz (2025) to 646 koz (2026f), with most Russian PGM exports to Western markets already constrained — metal flows overwhelmingly to China.
The UI is clean on a one-year chart; the supply chain is not — palladium traders must track sanction tweaks and Chinese import data, not only COMEX positioning.
BEV Transition: Real but Slower Than Feared
BEVs do not use gasoline TWCs — the long-term palladium bear case. JM and WPIC both note the transition has been slower than early forecasts, postponing some demand destruction in 2025–2026. Yet Chinese BEV production exceeded 10 million units in 2025 (roughly 70% of global BEV output), while ICE production also rose slightly — gasoline up about 2% in China — keeping near-term autocatalyst demand mixed.
For short-term CFD horizons, BEV policy headlines matter less than ETF liquidations and rate expectations; for 2027+, palladium’s gasoline dependency is the structural weight.
Why January’s Highs Collapsed: War, Inflation, Rates, and USD
CME’s framework applies directly to PGMs. Precious metals rallied into January on inflation fear and easing expectations, then sold off when:
- Warsh nomination reduced Fed-independence premium (late January)
- 28 February conflict spiked energy costs — gasoline up nearly $1/gal and diesel about $1.50/gal versus February in the US (AAA data cited by CME)
- Central banks reconsidered hikes — Bank of England floated up to three increases; ECB warned of tighter policy; Fed funds futures de-priced 2026–27 cuts
- USD rebounded as a flight-to-quality asset, negatively correlated with PGMs
WPIC’s juxtaposition is stark: Brent +55% since the conflict began, platinum −16%. Safe-haven logic failed because the marginal driver flipped to opportunity cost of holding non-yielding metals when real rates rise. That is the same 2019–2023 gold pattern Norland describes — metals front-ran inflation, then fell when inflation arrived and forced tightening.
If your account currency is not USD, the dollar rebound adds a second layer on top of spot PGM moves — track both the metal quote and FX when sizing risk.
South Africa Supply: Relief in Q1, Risk in the Medium Term
South Africa supplied 3,957 koz of platinum in 2025 — about 71% of global mine output. Q1 2026 mine supply rose 41% YoY without flood disruptions, a sharp short-term boost. North America, by contrast, is forecast down from 212 koz to 201 koz as Stillwater rationalises; secondary (recycled) supply is up about 9% YoY in 2026f as high prices pull scrap into the market.
Why Miners Can Still Fail to Relax Traders
Electricity load-shedding, labour relations, depth of mines, and policy uncertainty remain background risks even in a flood-free quarter. One strong Q1 does not remove concentration risk — it only delays it.
Personally, I treat South African headlines as volatility catalysts for platinum rather than as a reason to ignore JM’s palladium surplus call — the two metals share a mining region but not the same demand curve.
Practical Notes for Platinum & Palladium CFD Traders
PGM CFDs are workable but less forgiving than gold or silver on most platforms.
Liquidity, Spreads, and Position Size
Compared to XAU/USD or XAG/USD, platinum and palladium contracts typically show wider spreads and thinner depth — slippage on news spikes is real. Size positions smaller than you would on gold; use limits around known data releases (WPIC quarterly, JM annual, ETF flow headlines).
Minimum notional may look accessible, but percentage moves in PGMs have been larger than gold’s during the 2026 macro reversal — leverage cuts both ways.
Correlation and Hedging
On risk-off days, PGMs often follow gold directionally but with higher beta. Pair charts with DXY and front-end rate expectations — the same drivers that hit gold vs silver trading structures apply here, amplified by industrial demand noise.
Catalysts to Watch in 2026
- WPIC quarterly balances — especially ETF investment line and South African production
- JM palladium surplus confirmation — recycling and automotive TWC loadings
- Russia tariff and sanction updates — regional price splits
- BEV policy and Chinese export data — long-dated palladium demand
- Hydrogen subsidies and PEM project FIDs — platinum sentiment
- Central bank tone and energy prices — macro dominates short horizons
Fact plus verdict: platinum at $2,860 proved macro can overpower deficits short term; palladium above $2,100 proved tariffs and tight units can spike price — but both need rate and dollar context to interpret the next move.
Summary: Structural Stories vs Macro Reality
The platinum and palladium price forecast for 2026 is a tug-of-war. Platinum brings four years of deficits, hydrogen and HDD growth, and a January record at $2,860/oz — yet Q1 surplus, ETF selling, and macro tightening dragged price below $2,000. Palladium tagged $2,100+ on tight units and trade frictions, but faces JM’s potential 2026 surplus, BEV erosion, and the same rate-dollar headwinds that hit gold.
For CFD traders, respect thinner liquidity, track WPIC and JM releases, and pair PGM charts with rate expectations and the dollar — the same macro engine that moved gold and silver in 2026. Structural data sets the backdrop; positioning and policy set the tape.