





Want a simple answer for gold (XAUUSD)—without learning every chart tool first?
TR-MATE Trade Signals put clear horizontal lines on your chart: where to watch entry, where the idea is wrong (stop), and where profit targets sit. You look. You decide. No auto-trading — you stay in control.
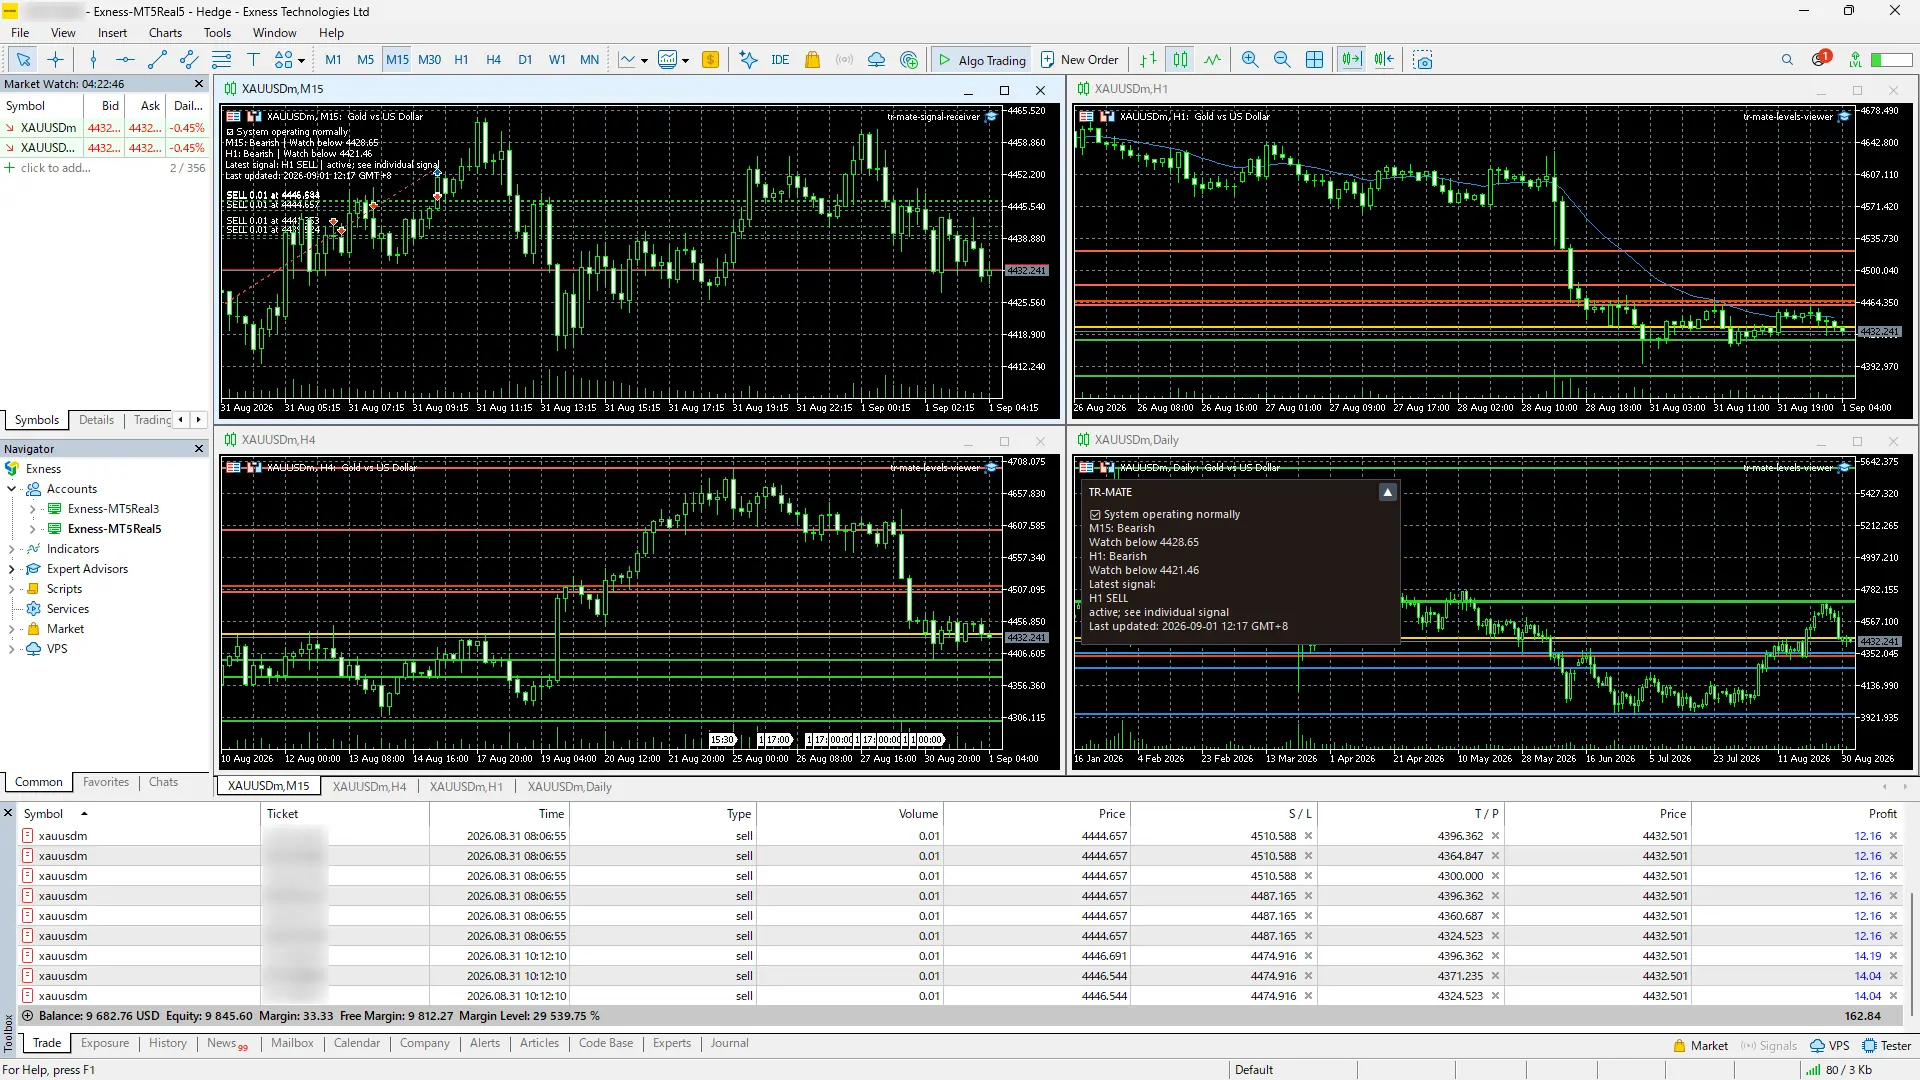
XAUUSD support and resistance levels, with entry, stop and take-profit
Many beginners open a gold chart and freeze: too many candles, too many indicators, no clear “what now?”
TR-MATE answers with a few horizontal lines you can read in seconds:
- Entry zone — the price area we are watching
- Stop line — if price goes here, the idea failed
- Take-profit lines — targets if the move works
That is the product: levels for your own analysis, not a bot that clicks Buy/Sell in your account.
How we calculate the gold support and resistance levels
These are not freehand marks. Behind each active set is a calculated map of nearby support and resistance—built from closed gold bars and several technical checks, not from one indicator or a gut feel. Entry, stop, and targets are then derived from that map with fixed risk rules.
- Structure first. Nearby support and resistance come from price history—swings, prior highs and lows, and related technical context—reviewed together so the levels reflect the current map, not a single shortcut.
- Entry, stop, and staged targets. From that map we place the lines you act on, with spacing tied to recent volatility. You see where the idea is wrong and where profit steps sit—before you think about size.
- When structure breaks. If price clearly breaks a mapped level, the displayed lines can refresh around the new structure. Still display-only: you decide; nothing auto-trades your account.
- Same chart, fuller picture. Structure horizontals—and selected overlays when useful—sit next to the signal lines, so you can check the idea without opening five other tools.
In one sentence: clear horizontals on your chart, backed by multi-factor structure and risk rules—not random lines.
Position size stays your decision. To turn a stop distance into money before you trade, use the XAUUSD lot size calculator and the XAUUSD profit calculator.
Do these XAUUSD levels actually hold? What broker OHLC showed
They work as a decision frame on the chart, not as walls that always hold. Useful means you can see where an idea is wrong (stop) and where follow-through may matter (targets)—then judge for yourself. We test that three ways: the published map itself, broker OHLC, and an internal research account trading the same levels. This section is the OHLC test—every level published between 21 Aug and 4 Sep 2026, replayed on real high / low / close paths.
What happened next on H1
21 Aug – 4 Sep 2026 · Exness MT5 OHLC · short sample
So: a first touch alone is a weak signal. After an early H1 bounce, failed-later and held-up were almost even in this sample—useful as a watch level, not as a guaranteed bounce trade. When an H1 level did break clearly, “kept going” beat “false break,” but clear breaks were uncommon. That is still useful: the lines mark places worth watching, and they tell you when the story has changed.
How these numbers were measured
- Levels published for the H1 timeframe, replayed on M15 bars from the moment each level was archived—no hindsight edits.
- A level counts as tested only when price trades into a band of ATR(14) × 0.35 around it.
- 16 M15 bars (about four hours) to classify the first bounce or clear break, then 16 more bars to score what followed.
- Kept going / held up = price never closed back through the level and finished beyond the band. False break = price closed back inside. Other = neither—price stalled inside the band by the end of the window.
- Sample: 307 bounce events, 29 clear breaks. The break sample is small, so read 48% / 28% as a direction, not a precise rate.
Research track record: the same gold levels, traded automatically
The third check: we run the same published levels on an internal research account of our own—so entry, stop, and targets are not a separate “secret system.” You get the chart lines; that automated execution stays on our research account, never on yours, and the figures below are not taken from any member’s account.
Latest research snapshot (Exness MT5, USD, XAUUSD):
| Item | Value |
|---|---|
| Period | 17 Aug 2026 – 3 Sep 2026 (~2.5 weeks) |
| Symbol | XAUUSD |
| Starting balance | $10,000 |
| Ending equity | $10,354.71 |
| Total net profit | +$354.71 (~+3.5%) |
| Profit factor | 1.25 |
| Max relative drawdown | 7.70% |
| Total trades | 94 |
| Profit trades | 43.62% |
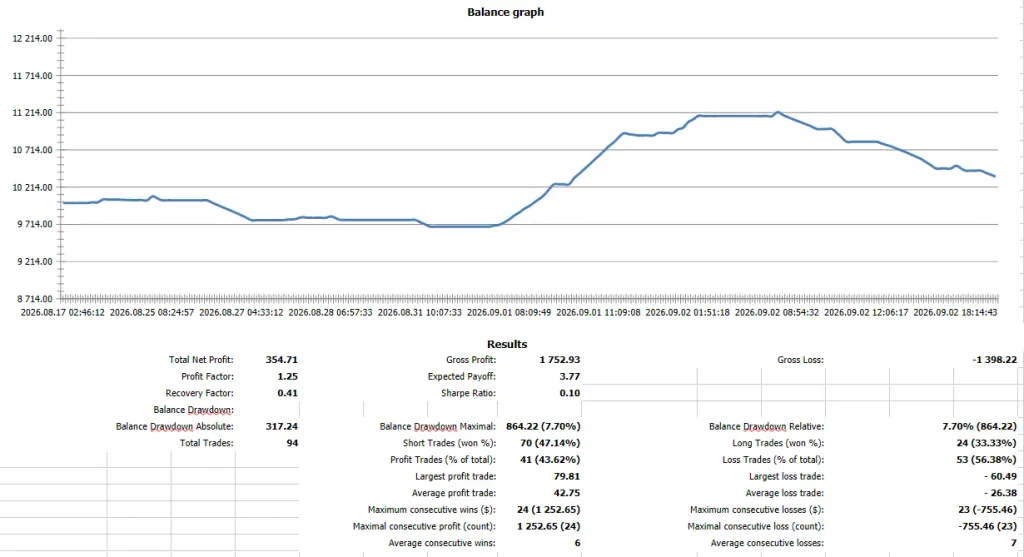
In that window, most research stops and targets lined up with the published map, and a win rate under 50% still finished net positive—wins that reached targets outweighed stop-outs on average.
Why we do not advertise an 80% win rate
Search for gold signals and you will find 80–90% win rates and thousands of “verified” calls. Our numbers are 43.62% profit trades and a profit factor of 1.25 across 94 trades. That is what a stop-based approach on gold normally looks like: more losers than winners, with the winners bigger than the losers.
A very high advertised win rate on gold usually means one of three things—stops far wider than targets, losing calls quietly deleted, or a sample too short to mean anything. Those are the patterns described in how to spot fake trading results. Two and a half weeks and 94 trades is a short sample too; we publish it because it is what we actually have, not because it proves an edge.
So… are the horizontals useful?
For reading risk and structure on gold—yes, in this window they earned a look. Three checks, one short sample; none is a guarantee, but together they answer “will these lines help my analysis?” rather than “will every touch win?”:
- Analysis logs. Levels are calculated from closed gold bars and multi-factor structure, then published on a schedule—not drawn freehand on the chart.
- Broker OHLC. We measure what happened after price touched those levels on real MT5 paths—including failed bounces and false breaks, not only flattering cases.
- Trade history. The same map drove a research account: ~+3.5%, profit factor 1.25, max drawdown 7.70%, win rate under half—but net gain when winners were larger than losers.
Plain reading: useful ≠ always right. Short sample only; past paths and past P&L do not promise next week. The claim is narrower: calculated levels you can verify—on the map, on OHLC, and against research trades—so you can decide if they help your process.
What you get (Premium)
- Those horizontal lines on MetaTrader 5 via the levels viewer
- Updates through the member area and private Discord
- Space to learn by looking at levels first—before you risk real size
What you do not get
- No auto-trading. Lines appear on your chart. Your broker account does not open trades by itself.
- No “guaranteed win” story. Lines can fail. Stops exist for a reason.
- No personal advice. You still choose whether to trade, how much, and whether the setup fits your rules.
What Premium costs
There is no subscription fee. A Basic member account is free. Premium—the levels viewer, member-area updates and private Discord—unlocks once you hold an eligible broker account opened through TR-MATE. That can be a new account through our link, or an account you already have if the broker reassigns its IB to TR-MATE.
Eligible brokers today: Exness, Vantage, HFM, XM, ThinkMarkets, Pepperstone. Availability depends on your jurisdiction.
Being clear about the model: the broker pays us a referral commission out of the spread you would pay anyway, which is why you pay us nothing. It also means you should still judge a broker on its own merits—gold spread, execution and withdrawals. Our XAUUSD spread comparison puts those gold spreads side by side.
What you need to run the levels viewer
- MetaTrader 5 on a desktop computer. The EA fetches levels over WebRequest, which the MT5 mobile and web terminals do not support—a phone-only setup cannot display the lines.
- A gold (XAUUSD) chart at your broker. Levels are published for gold only.
- MT5 left running for the lines to keep refreshing. A spare PC or a VPS is enough.
- AutoTrading stays off. The EA draws lines and never sends an order, and we never ask for your broker password or investor password.
How to start (4 steps)
Use the button below to create a free member account.
If you already have a broker account opened through TR-MATE, submit that account number for review. If you do not have one yet, open an eligible broker account through TR-MATE first, then submit the account number. After approval, you become a Premium member.
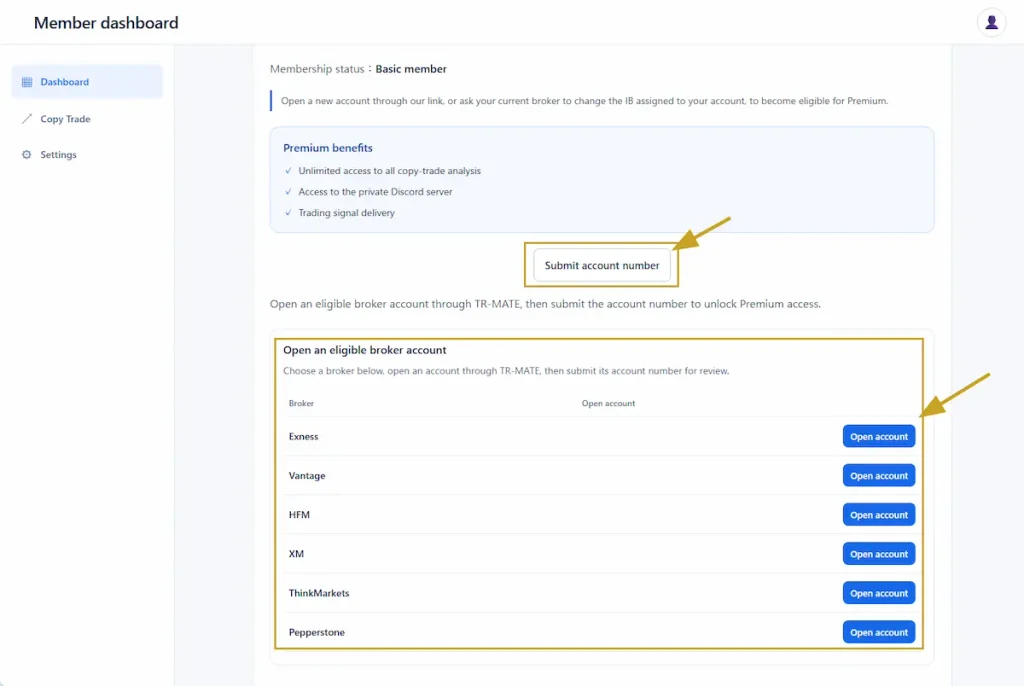
After you upgrade to Premium, open the member area and download the levels viewer EA to your computer.
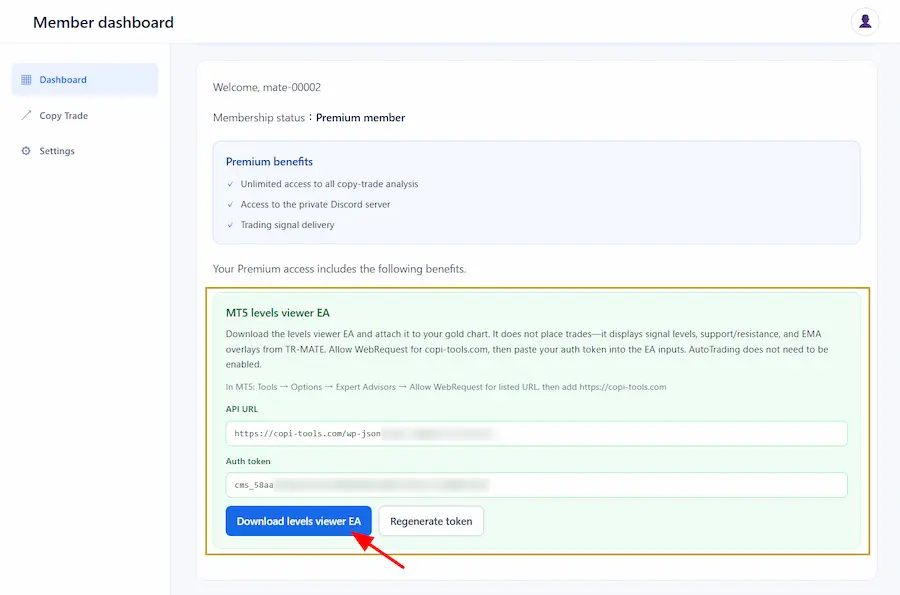
Put the EA in MT5, allow WebRequest for copi-tools.com, attach it to your gold chart, and paste your member token. The horizontal lines will appear for you to study.
How to install and attach the levels viewer
- Open MetaTrader 5.
- Go to File → Open Data Folder.
- Open the MQL5 folder, then the Experts folder.
- Drag and drop the downloaded levels viewer file into the Experts folder.
- Back in MT5, right-click Expert Advisors in the Navigator and choose Refresh (or restart MT5). You should see
tr-mate-levels-viewer. - Go to Tools → Options → Expert Advisors, enable Allow WebRequest for listed URL, and add
https://copi-tools.com. - Open your gold (XAUUSD) chart, then drag
tr-mate-levels-vieweronto the chart. - In the EA inputs, paste your member auth token from the member area, then confirm.
Who this is for
- Beginners who want a clear chart answer while they learn
- People who like analysis but hate tool overload
- Anyone who prefers “show me the levels” over “trust a secret bot”
Skip this if you need fully hands-off auto-trading or guaranteed profits. Gold CFDs can lose the money you put in.
FAQ
Related gold tools
- Gold dashboard — live XAUUSD price, news and analysis, free to view
- XAUUSD lot size calculator — turn a stop distance into a position size
- XAUUSD profit calculator — what a move to each target is worth
- XAUUSD spread comparison — gold spreads across eligible brokers
Ready to look at the levels?
Start free. Upgrade to Premium when you want the lines on your chart and Discord updates.
Risk warning
CFDs and leveraged gold trading involve a high risk of loss. TR-MATE provides research tools, educational content, and signal levels for analysis—not investment advice and not a managed trading service. Premium access depends on your jurisdiction and eligible broker-account review. Historical research results on this page do not guarantee future performance.
About this page: levels are generated and archived by the TR-MATE analysis system that also powers our gold dashboard, which is what lets us replay past levels against broker OHLC afterwards. Performance figures come from our own research account, not from member accounts. TR-MATE is compensated by referral commission from the brokers listed above. Data on this page: OHLC study 21 Aug – 4 Sep 2026; trade record 17 Aug – 3 Sep 2026 (Exness MT5, USD).